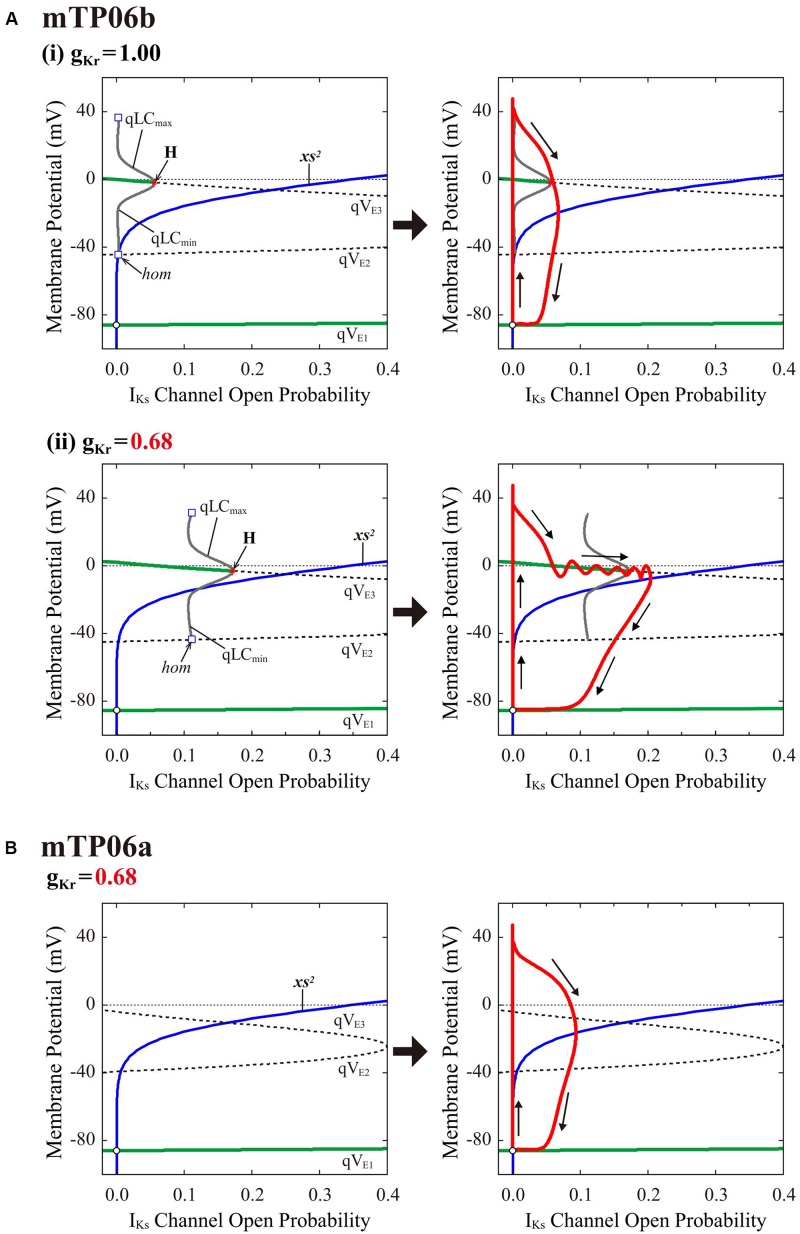
FIGURE 7.
Dynamical mechanisms of EAD initiation and termination determined by the slow-fast decomposition analysis for the mTP06 models. Shown are one-parameter bifurcation diagrams of quasi-equilibrium points (qEPs) and quasi-limit cycles (qLCs), where the steady-state branches as loci of Vm at qEPs (qVE1–3) and periodic branches as the potential minimum (qLCmin) and maximum (qLCmax) of qLCs are depicted as functions of the square of the IKs activation gating variable (xs2), i.e., IKs channel open probability for the fast subsystems of the gKr-normal [A-(i), left] and gKr-reduced [A-(ii), left] mTP06b model and gKr-reduced mTP06a model (B, left). Other slow variables, Nai and CaSR, were fixed at constant values: Nai = 6 mM for all cases; CaSR was fixed at the value which was reached just before occurrence of the first EAD or the maximum values during AP phase 2 (when no EAD occurred), i.e., at 0.5 mM and 1.5 mM for the normal and gKr-reduced mTP06b model, respectively, and at 0.5 mM for the gKr-reduced mTP06a model. The steady-state branches consist of the stable (green solid lines) and unstable (black dashed lines) segments. The periodic branches (gray solid lines) are all unstable. The blue lines indicate the steady-state xs2 curve. Trajectories of the full system (with the fixed CaSR and Nai) are superimposed on the bifurcation diagrams for the fast subsystems (red lines in each right panel). The arrows indicate the directions of changes in the state variables. H, Hopf bifurcation; hom, homoclinic bifurcation.

