FIGURE 8.
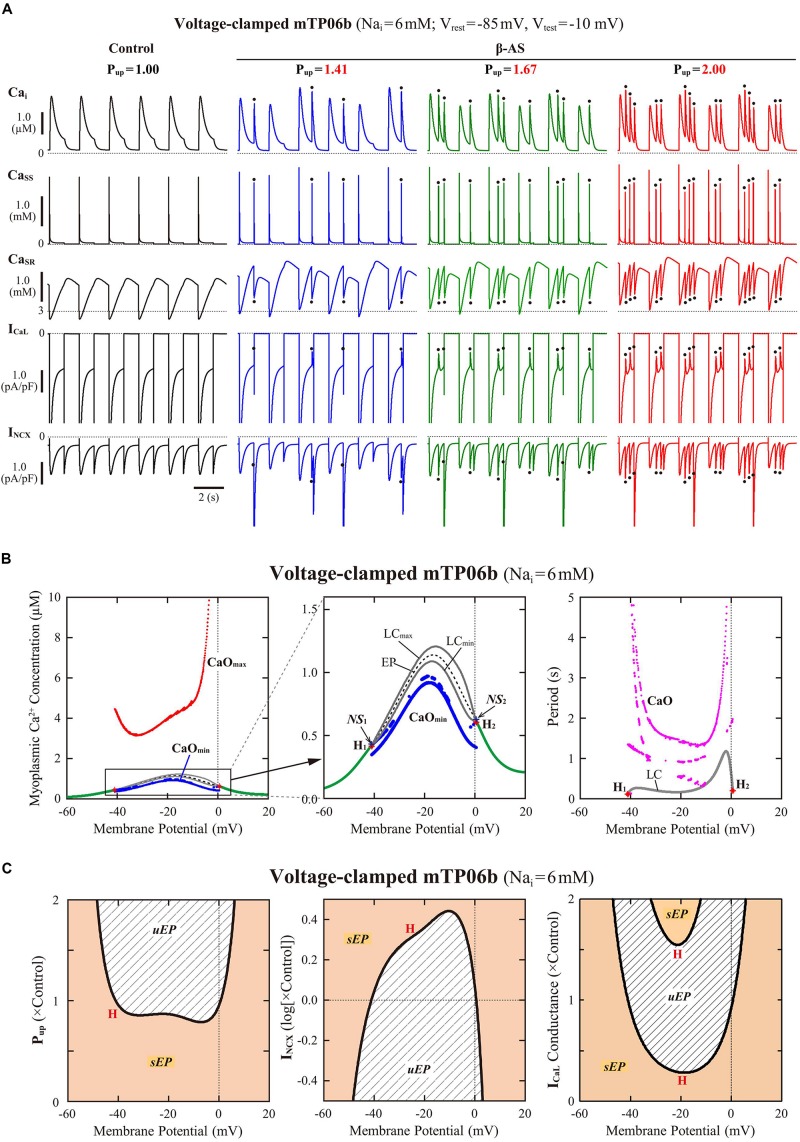
Stability and bifurcations of intracellular Ca2+ dynamics in voltage-clamped mTP06b model cell. (A) Dynamics of intracellular Ca2+ concentrations as well as Ca2+-dependent sarcolemmal currents in the Nai-fixed voltage-clamped model cell under the control condition (Pup = 1) and the conditions of β-AS (Pup = 1.41, 1.67, and 2.00). Temporal behaviors of the voltage-clamped model cell during a train of 1-s step depolarization from −85 mV to −10 mV at 0.5 Hz were computed for 10 min; Cai, Cass, CaSR, ICaL and INCX for the last 12 s (6 pulses) are shown as steady-state dynamics. Spontaneous SR Ca2+ releases, as evidenced by abrupt falls of CaSR and increases in Cai, Cass and inward INCX with attenuated ICaL, occurred at higher Pup (indicated by the dots). (B) One-parameter bifurcation diagrams of the equilibrium point (EP) and extrema of limit cycles (LCmin/max) and spontaneous Cai oscillations (CaOmin/max) as functions of Vm for the voltage-clamped model cell (left and middle). The middle panel shows an enlarged diagram of the rectangular area in the left panel. The periods of spontaneous Ca2+ oscillations (CaO) and limit cycles (LC) are also plotted against Vm (right). H1–2, Hopf bifurcations of the EP; NS1–2, Neimark-Sacker bifurcations of the LC. (C) Two-parameter diagrams on the Vm–Pup (left), Vm–INCX (middle) and Vm–gCaL (right) planes, indicating how the unstable Vm range changed depending on Pup, INCX and ICaL. HB values, i.e., the critical Vm at which an EP is (de)stabilized are plotted as functions of Pup, INCX and ICaL for the Nai-fixed mTP06b model; the HB points were very close to the Neimark-Sacker bifurcation points at which LCs were destabilized with the emergence of CaOs.

