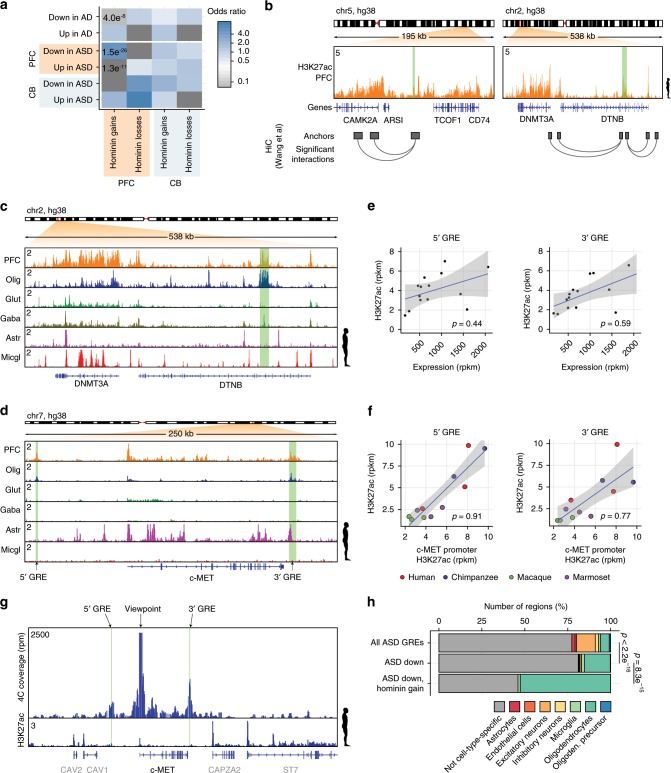
Fig. 4. Hominin-specific gains are selectively deregulated in autism patient brains.
a Heatmap showing enrichment of disease-associated GREs deregulated in ASD and AD patient brains correlating with hominin-specific changes found in cerebellum (CB) and prefrontal cortex (PFC). Color indicates odds ratio of enrichment compared to all identified GREs. P values were determined using a Fisher’s exact test. b Chip-seq track showing rpm normalized H3K27ac enrichment across regions containing the CAMK2A (left panel) and DNMT3A (right panel) gene in human PFC. Hominin-specific PFC gains are highlighted in green. Chromosomal interactions are indicated by the boxes below the panel. c ChIP-seq tracks as in (a), for the DNMT3A gene in human PFC and different isolated cell types. A hominin-specific PFC gain is highlighted in green. PFC prefrontal cortex, Olig oligodendrocytes, Glut glutamatergic neurons, Gaba GABAergic neurons, Astr astrocytes, Micgl microglia. d ChIP-seq tracks as in (b) for a region containing the c-MET gene in human PFC and different isolated cell types. Two hominin-specific PFC gains are highlighted in green. e Correlation of H3K27ac enrichment in the 5′ and 3′ GRE with expression of the c-MET gene in autism patients. Black dots represent samples, blue line represents linear regression through the samples, gray area highlights the 95% confidence interval. f As in (e), correlation of H3K27ac enrichment on the 5′ and 3′ GRE with H3K27ac enrichment on the promoter. Dots represent the different samples, colors indicate species. g 4C-seq and rpkm normalized H3K27ac ChIP-seq tracks of human white matter in a region containing the c-MET gene. The c-MET-promoter was used as viewpoint for the 4C analysis. The green highlighted areas indicate the location of hominin-specific PFC gains as shown in (d). h Bar plot showing the cell-type specificity of regions based on single-cell ATAC-Seq data, on regions identified in ASD patients and control brains, regions specifically downregulated in ASD patients and those that are down in ASD as well as hominin-specific gain in PFC. Difference in oligodendrocyte-specific frequency was calculated using a Fisher’s exact test. Source data are provided in Source Data file.

