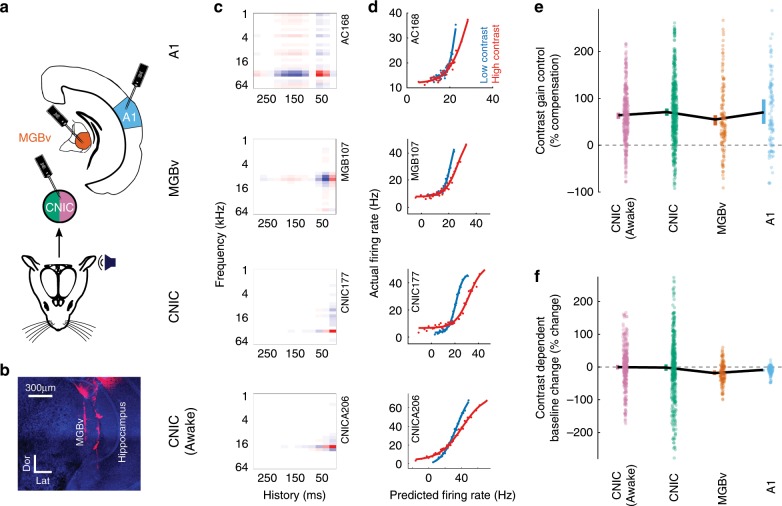
Fig. 3. Contrast adaptation in the lemniscal auditory pathway.
a Schematic illustrating recordings in A1 and MGBv (under anesthesia) and in the CNIC (in both anesthetized and awake mice). b Confocal image showing DiI-coated electrode tracks in the MGBv (Dor, dorsal, Lat, lateral; scale bar, 300 µm). c Example STRFs from units recorded in each brain region (red: positive, white: 0, blue: negative). d Contrast-dependent output nonlinearities for these same four units. e Magnitude of contrast gain control in the auditory pathway, measured as % compensation where 100% would indicate a halving of the gain when the contrast is doubled. f Contrast-dependent changes in the baseline activity (y-offset of the output nonlinearity) in the auditory pathway. Colored error bars in e, f, 95% bootstrapped non-parametric confidence intervals (individual data points (excluding outliers) are displayed next to the corresponding error bars). Source data for e, f are provided as a Source Data file.

