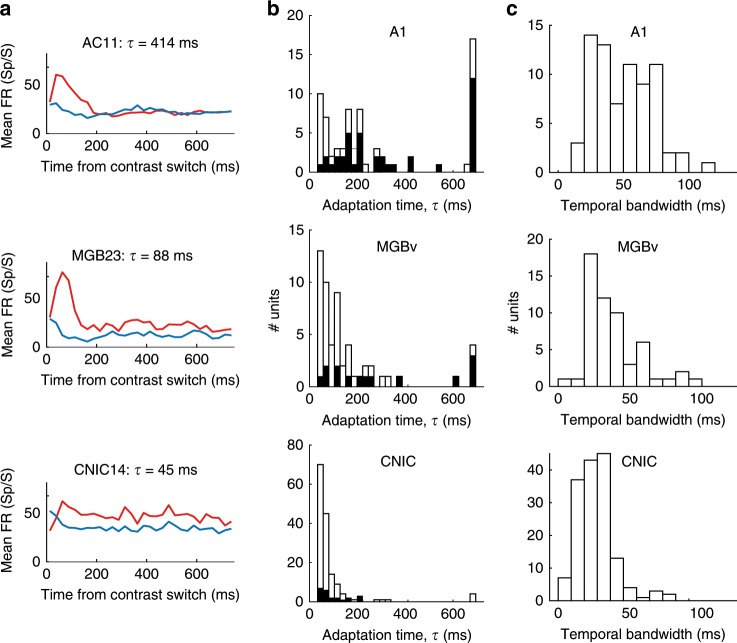
Fig. 6. Increasing time constants of contrast adaptation along the ascending auditory pathway.
a Mean PSTHs from example units recorded in A1, MGBv, and CNIC after switching from low to high contrast (red) or high to low contrast (blue). The adaptation time constant for these units is given above each plot. b Contrast adaptation time constants (τ) for all units recorded using continuously switching contrasts in A1, MGBv, and CNIC. Black bars indicate a subset of these units whose model prediction performance (ccpred) was improved by including an adaptation time constant in the contrast-dependent LN model. c Temporal bandwidth of these units. Source data for b, c are provided as a Source Data file.

