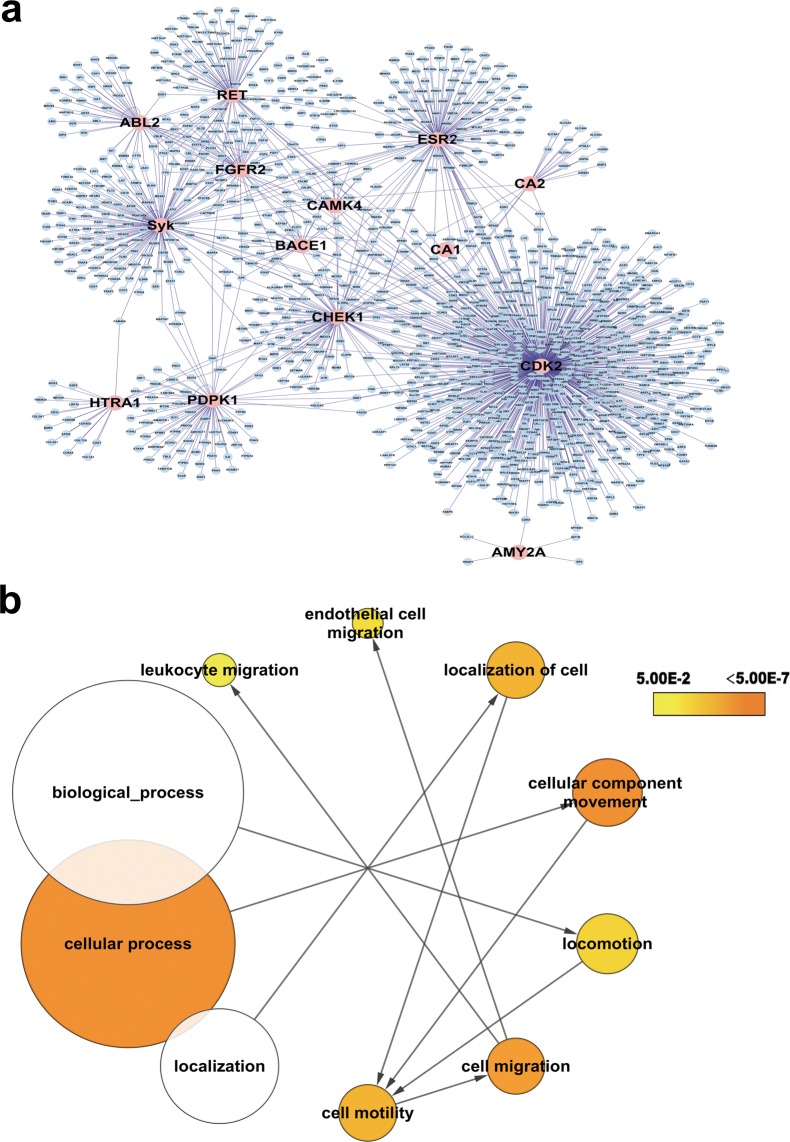
Figure 3.
Identification of key proteins contributing to the effects of FM on cell migration. (a) Protein-protein interaction (PPI) network derived from reverse target screening. The PPI network comprises 1254 nodes and 1463 edges, with pink nodes representing the 15 human seed proteins. (b) Gene Ontology (GO) analysis was conducted on the PPI network to enrich nodes based on their “biological processes” annotation. The structure of cell motility-relevant GO and root terms are depicted. The color of the GO term represents the p-value and size signifies the number of enriched proteins.

