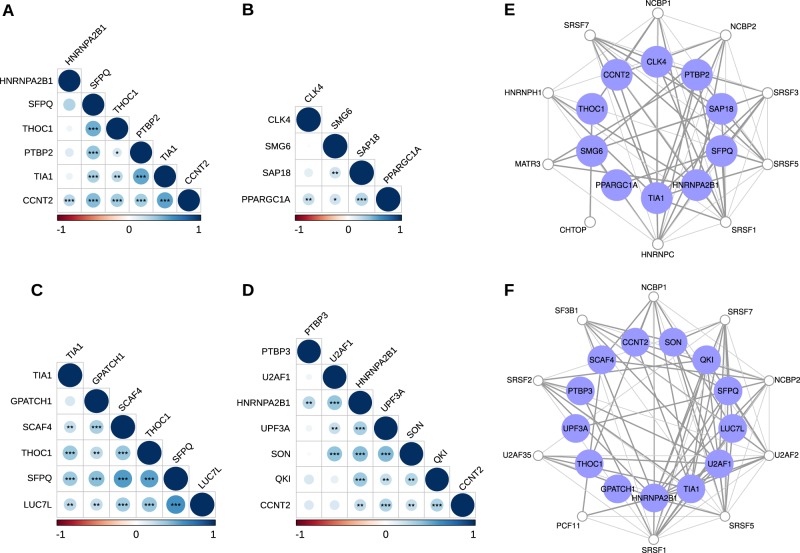
Fig. 6. RBPs co-expressed in mesenchymal and proneural GBM samples.
Correlation plots display RBPs positively correlated in (a, b) mesenchymal GBM; and (c, d) proneural GBM (Spearman’s significance: **p-value < 0.01; ***p-value < 0.001). Interaction networks show RBPs functionally related from (e) mesenchymal GBM and (f) proneural GBM. Blue nodes represent selected RBPs, while white nodes were additionally included in the network to give a broader context of associations between the RBPs. Only experimentally validated associations are shown in gray.

