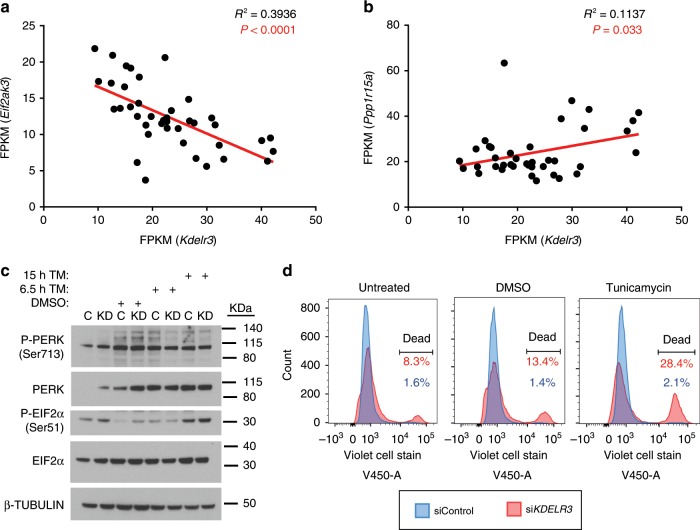
Fig. 4. KDELR3 and the ER stress response in metastatic melanoma.
a Scatter plot of Eif2ak3 (Perk) RNA expression vs. Kdelr3 RNA expression. Linear regression analysis, R2 = 0.3936, P < 0.0001. b Scatter plot of Ppp1r15a (Gadd34) RNA expression vs. Kdelr3 RNA expression. Linear regression analysis, R2 = 0.1137, P = 0.03. a, b Data from four independent mouse models of melanoma (see Methods). Each dot represents one mouse. M1, N = 9 mice; M2, N = 6 mice; M3, N = 12 mice; M4, N = 13 mice. c Western blot analysis of PERK and eIF2α signaling (1205Lu cells). Non-targeting control (shControl, C) and KDELR3 knockdown (shKDELR3, KD) in cells were untreated or treated with 3 µg/ml tunicamycin (TM) or DMSO control for the indicated time. Immunoblot with antibodies specified, β-tubulin loading control. d Live/dead violet cell stain in KDELR3-knockdown 1205Lu cells. Untreated, DMSO, and tunicamycin (2.5 μg/ml) treatment groups were treated 18 h before collection. The right-hand peak on the graph indicates the percentage of dead cells. Representative of three independent experiments (c, d).

