
Fig. 1. Proteomics-based identification of survival-relevant subgroups in (standard-of-care) control group patients (n = 20).
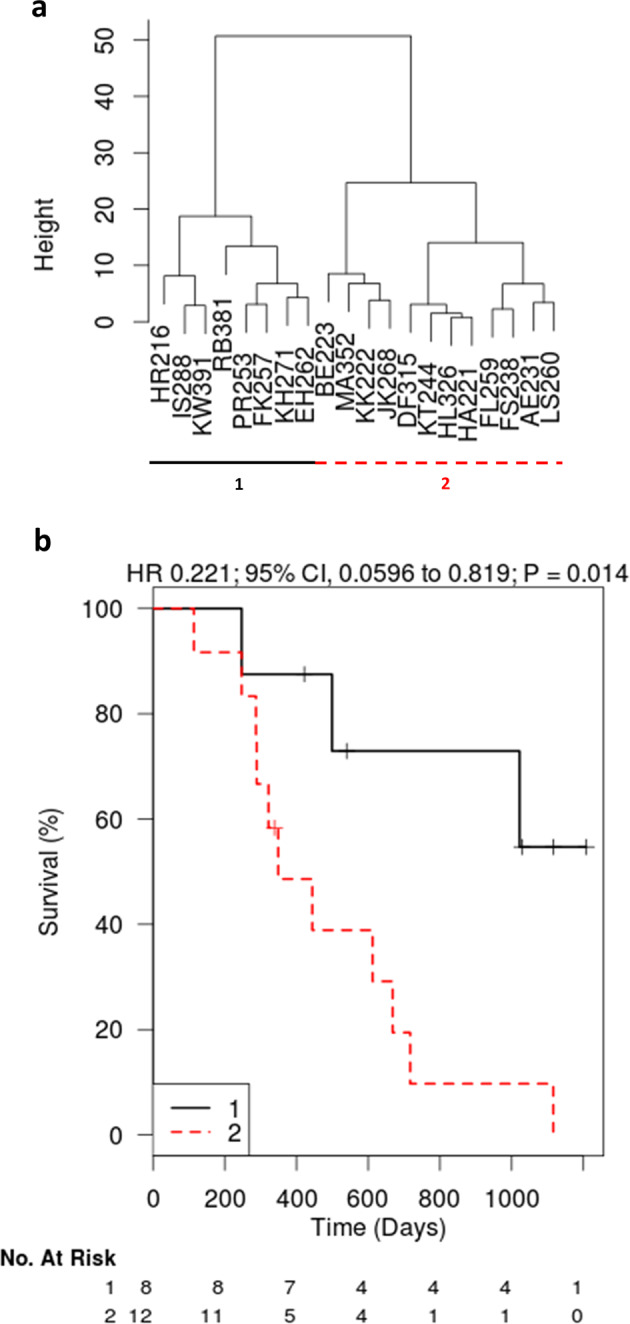
“Height” represents an arbitrary unit for the similarity of the proteome profile of the respective samples (i.e. a measure of distance). The denominations at the bottom (e.g. HR216, IS288) represent single patients (pseudonyms). a Unsupervised clustering led to the definition of a group with a significantly worse survival outcome (p = 0.014) (b).