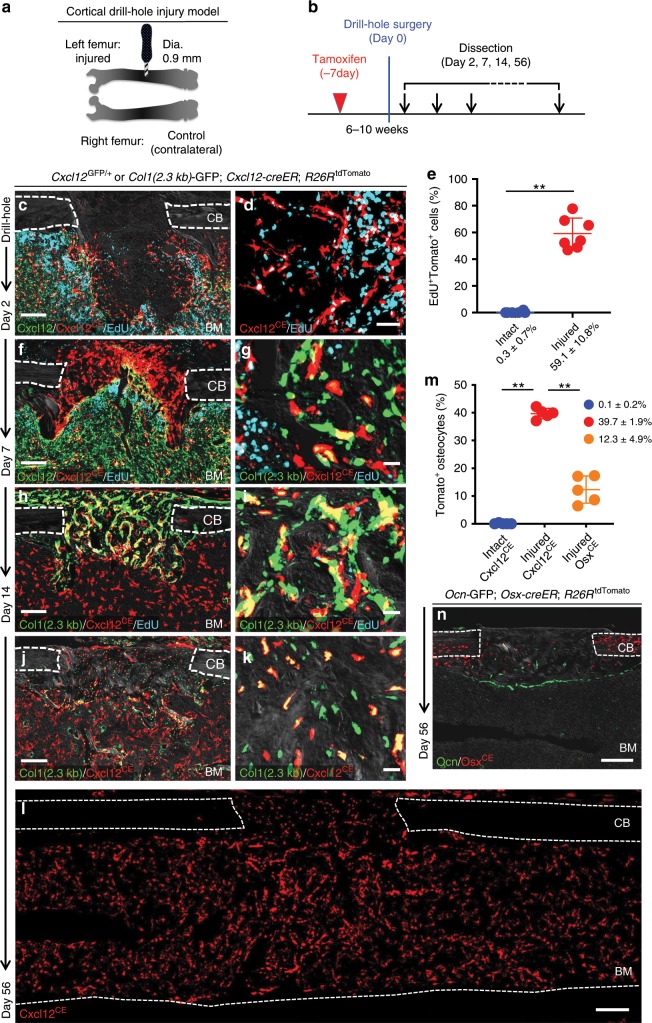
Fig. 4. Cortical bone regenerative responses of Cxcl12-creER+ BMSCs.
(a–n) Fates of Cxcl12-creER+ cells or Osx-creER+ cells during cortical bone regeneration after drill-hole injury. a Experimental schemes for drill-hole cortical injury model. b Timeline for tamoxifen injection, drill-hole injury and analysis. Cxcl12GFP/+; Cxcl12-creER; R26RtdTomato (c, f) or Col1(2.3 kb)-GFP; Cxcl12-creER; R26RtdTomato (g–k) femur diaphyseal cortical bones (pulsed at 7 days before surgery) with periosteum on top. CB cortical bone, BM bone marrow. Gray: DIC. n = 5 mice per each group. c, d Injured area at 2 days after injury, femurs with EdU administration shortly before analysis. Scale bar: 200 µm (c), 50 µm (d). e Quantification of EdU+tdTomato+ cells. n = 6 (Intact), n = 7 (Injured). EdU was administered twice (6 and 3 h) prior to analysis. **p < 0.01, two-tailed Mann–Whitney’s U test. f, g Injured area at 7 days after injury, femurs with EdU administration shortly before analysis. Scale bar: 200 µm (f), 20 µm (g). h, i Injured area at 14 days after injury, femurs with EdU administration shortly before analysis. Scale bar: 200 µm (h), 20 µm (i). j–l Injured cortical bone at 56 days after injury. Scale bar: 200 µm (h, l), 20 µm (i). m Number of tdTomato+ cells within intact and injured are of Cxcl12-creER; R26RtdTomato cortical bone (blue and red dots, respectively) or injured area of Osx-creER; R26RtdTomato cortical bone (orange dots). n = 5 mice per group. **p < 0.01, two-tailed, Mann–Whitney’s U test. n Injured cortical bone at 56 days after injury, Ocn-GFP; Osx-creER; R26RtdTomato femurs. All data are presented as mean ± s.d. Source data are provided as a Source Data file.

