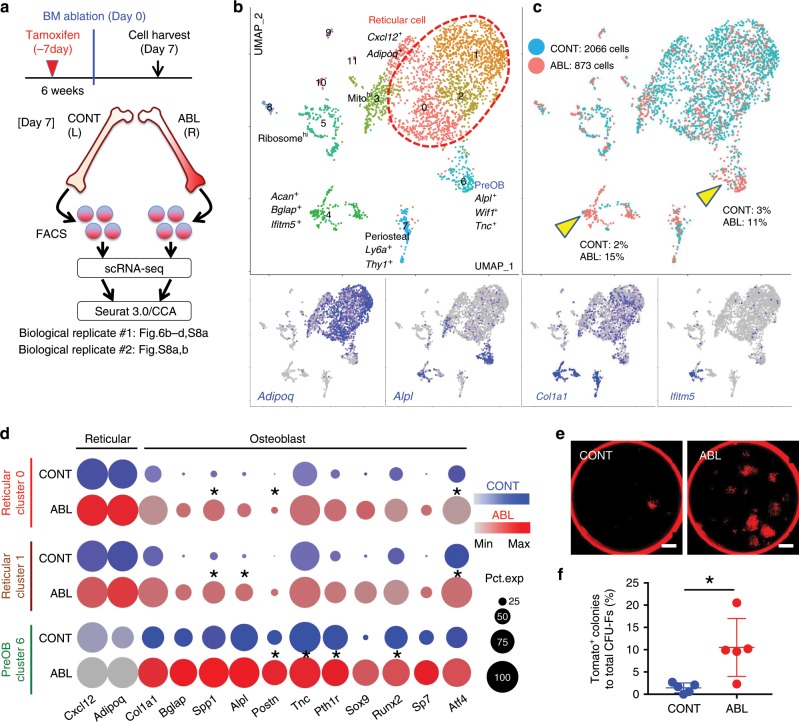
Fig. 6. Injury-induced identity conversion of Cxcl12-creER+ BMSCs.
a–d Single-cell RNA-seq analyses of lineage-traced Cxcl12-creER+ cells. a Cxcl12CE-tdTomato+ cells were isolated from contralateral (CONT) and ablated (ABL) femurs separately at 7 days after marrow ablation. Two datasets were integrated by Seurat/CCA. b, c UMAP-based visualization of major classes of mesenchymal Cxcl12CE-tdTomato+ cells (Cluster 0–11). Left panel, red dotted contour: reticular (Clusters 0–2). Lower panels: feature plots. Blue: high expression. Right panel: cells colored by conditions (CONT, ABL). Biological replicate 1, n = 2939 cells (CONT: 2066 cells, ABL: 873 cells), pooled from n = 7 mice. d Split-dot-based visualization of representative gene expression. Clusters 0 and 1 (reticular) and Cluster 6 (pre-osteoblast) shown for reticular-signature genes (Cxcl12, Adipoq) and osteoblast-signature genes (Col1a1, Bglap, Spp1, Alpl, Postn, Tnc, Pth1r, Sox9, Runx2, Sp7, Atf4). *p < 0.0001, Wilcoxon rank sum test. Circle size: percentage of cells expressing a given gene in a given cluster (0–100%), Color density: expression level of a given gene. e, f CFU-F assay of Cxcl12CE-tdTomato+ bone marrow cells, harvested from contralateral (CONT, left) and ablated (ABL, right) femurs at Day 7 (pulsed at Day-7). Scale bars: 5 mm. g Percentage of tdTomato+ colonies among total CFU-Fs. n = 5 mice per group. *p < 0.05, two-tailed, Mann–Whitney’s U test. Data are presented as mean ± s.d. Source data are provided as a Source Data file.

