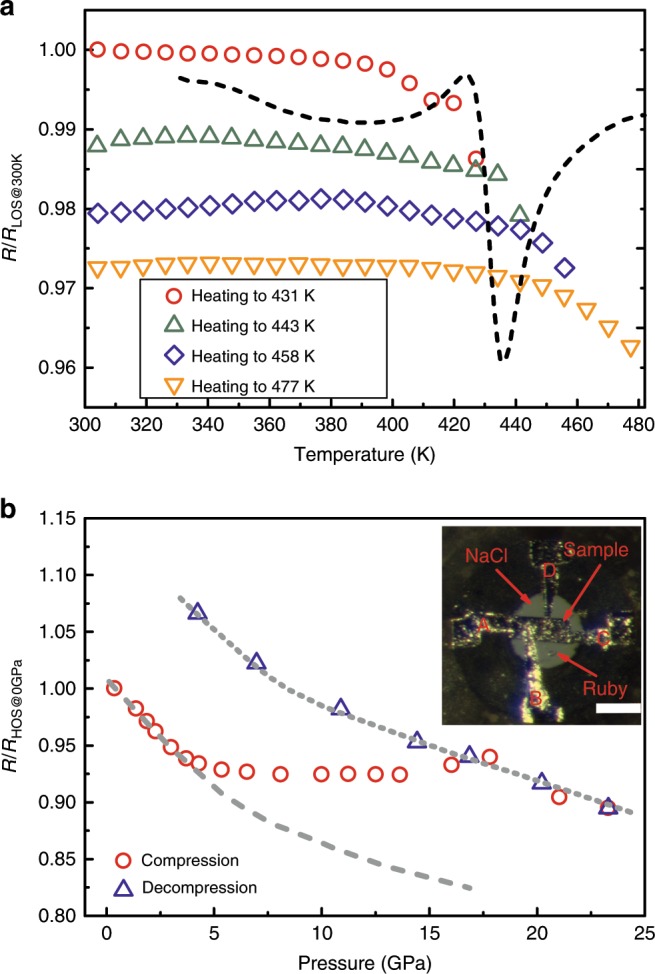
Fig. 4. The resistance measurements of the Ce65Al10Co25 MGs during structural ordering and disordering.

a The relative resistance changes of the Ce65Al10Co25 LOS sample during repeated heating to the different temperatures in the ordering peak of the DSC curve (shown with dash line). It is clear that the resistance decreases obviously once the sample was heated above T1, and it is irreversible and quenchable to room temperature. b The relative resistance change of the Ce65Al10Co25 HOS sample under compression and decompression. Two different states, HOS and LOS/HP-LOS, are indicated by dashed and dotted lines. The resistance of the sample firstly changes along the dashed line during compression, above ~ 5 GPa it deviates from the initial trend and eventually follows the new trend of the dotted line with a transition zone from ~ 5 GPa to ~18 GPa. The inset displays the image of the HOS sample in the DAC for resistance measurement together with four Pt foil electrodes and a ruby ball for pressure calibration. The scale bar represents 100 μm. The error bars for the resistance and pressure measurements are both smaller than the symbol size.
