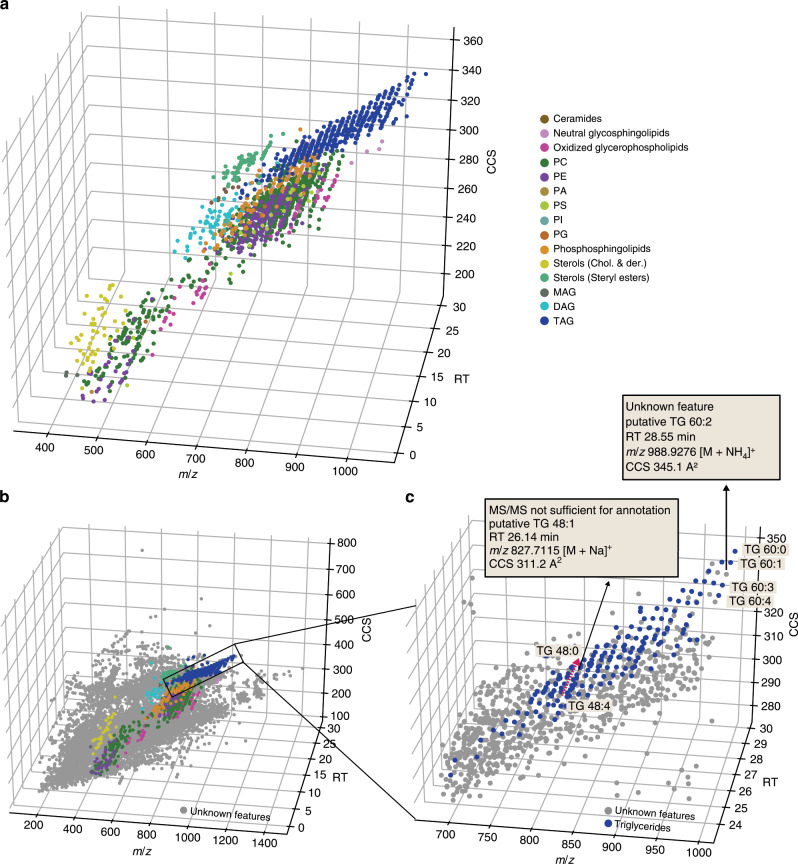
Fig. 6. The conformational landscape of lipid ions in TIMS.
a Three-dimensional (RT, m/z, CCS) distribution of 1856 lipids from various classes from three biological samples (plasma, liver, HeLa) in positive ion mode. b Overlay of unidentified (gray) and identified MS features detected in a human plasma sample. c Zoom into the data cuboid and putative assignment of two previously unidentified lipids based on their relative position in the data space. PC = Phospatidylcholine, PE = Phospatidylethanolamine, PA = Phosphatidic acid, PI = Phospatidylinositol, PG = Phospatidylglycerol, PS = Phospatidylserine, MAG = Monoacylglycerol, DAG = Diacylglycerol, TAG = Triacylglycerol.

