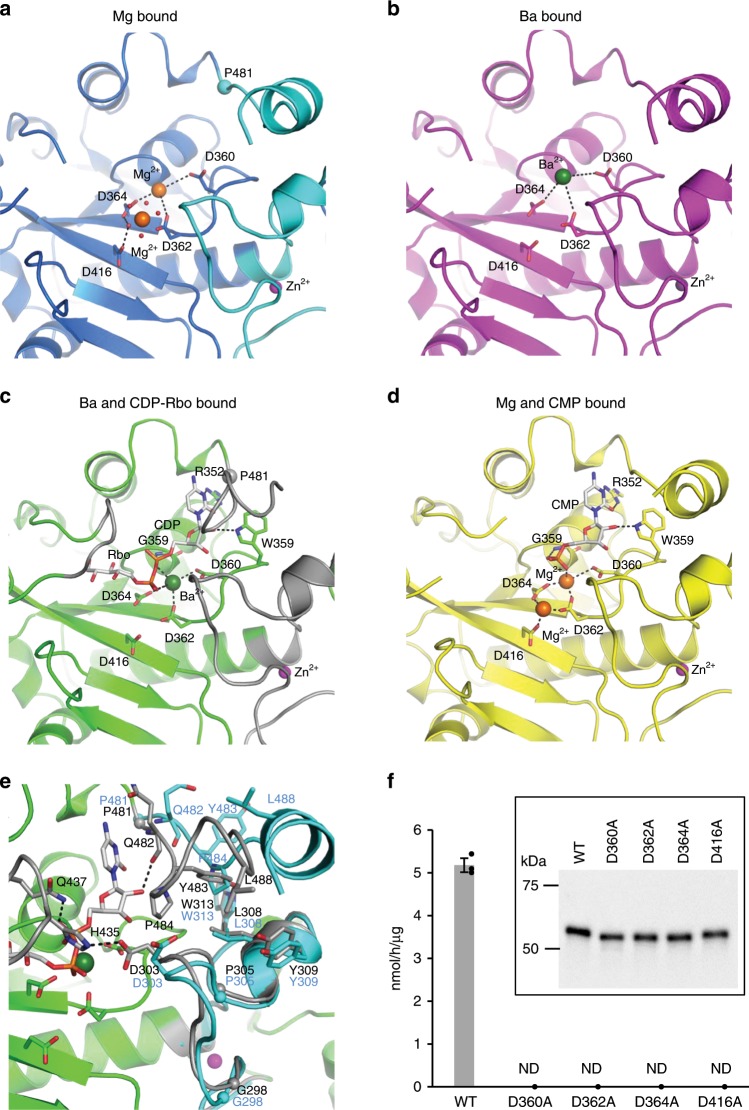
Fig. 3. Detailed structures around the active site.
The main chain of sFKRP is shown in the cartoon model. Black dotted lines represent hydrogen bonds or ionic interactions. Each metal ion is shown by colored spheres: Mg2+ by orange, Zn2+ by purple, and Ba2+ by green. a Mg2+ bound structure. Water molecules which coordinate Mg2+ at site II are shown as red dots. b Ba2+ bound structure. c CDP-Rbo (stick model) and Ba2+ complex structure. The regions involved in the interaction with CDP-Rbo are shown in gray. d CMP (stick model) and Mg2+ complex structure. e Comparison with CDP-Rbo bound (corresponds to (c), green and gray) and substrate-free (corresponds to (a), sky blue) structures. The start point (P481) of conformational change induced by ligand binding is marked with a small sphere. f Enzymatic activities of sFKRP (WT, D360A, D362A, D364A, and D416A) with CDP-Rbo and the RboP-(phospho-)core M3 peptide. ND, not detected. Average values ± SE of three independent experiments are shown. Each dot represents one data point. Inset: immunoblot analysis of sFKRP proteins immunoprecipitated from the culture supernatant to normalize input sFKRP. Source data are provided as a Source Data file.

