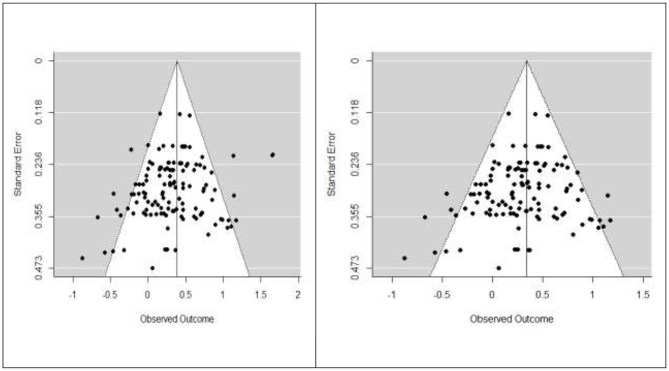
Figure 2.
Funnel plot of the meta-analysis of main outcomes of all studies (left) and of published studies (right). Each plotted point represents the standard error and standardized mean difference (Hedge's g) between control and Intervention group for a single outcome. The white triangle represents the region where 95% of the data points are expected to lie in the absence of publication bias. The vertical line represents the estimated effect size, based on the meta-analysis.

