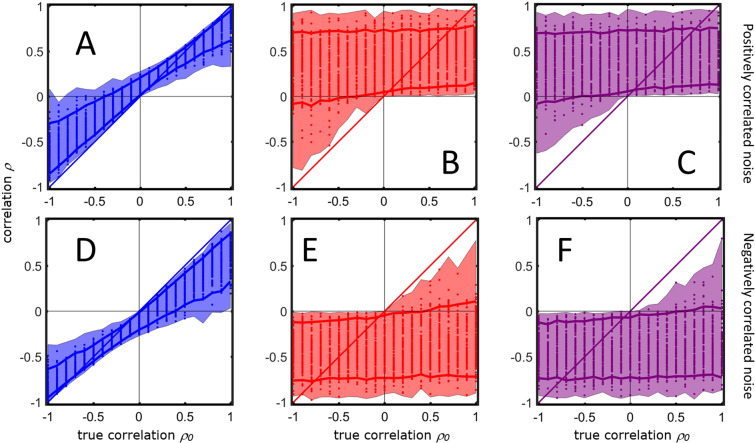
Figure 6.
Calculations of the correlation coefficient (40) as a function of the different realizations of the signal means and the size of the error components for different values of the true correlation . The shadowed area encloses the maximum and the minimum of the values of calculated in the simulation using the different error models. The dots represent the realized values of (only 100 of 105 Monte Carlo realizations for different values of the variances of error component are shown). The solid lines represent the 5-th and the 95-th percentiles of the observed values. (A) Additive measurement error with positive correlated error. (B) Multiplicative measurement error with positive correlated error. (C) Realistic case with both additive and multiplicative measurement error with positive correlated error. (D) Additive measurement error with negative correlated error. (E) Multiplicative measurement error with negative correlated error. (F) Realistic case with both additive and multiplicative measurement error with negative correlated error. For more details on the simulations see Material and Methods section 6.5.5.

