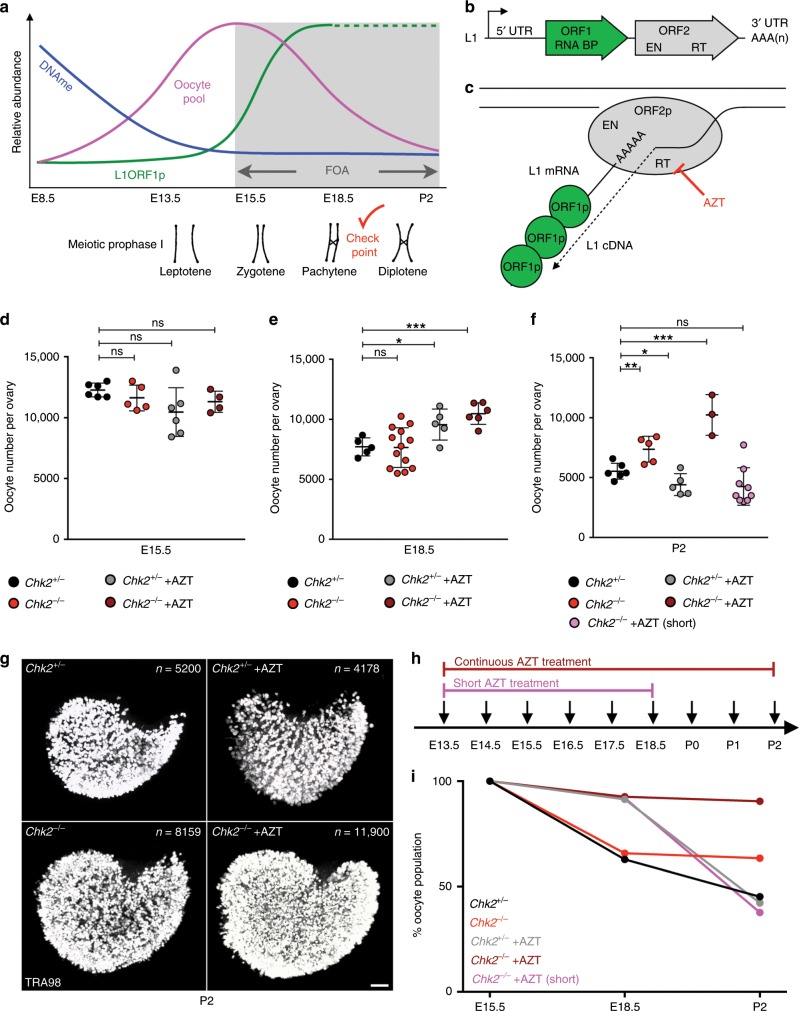
Fig. 1. Experimental evasion of L1-instigated FOA.
a Model of developmental programs influencing the oocyte pool (pink) and FOA (gray). DNA methylation (DNAme) is erased genome-wide for epigenetic reprogramming (blue). Loss of DNAme on L1 sequences permits L1 ORF1p expression at E15.5 that peaks around E18.5 (green). How L1 expression is regulated beyond E18.5 is unknown (dotted green). Entry into meiotic prophase I (consisting of leptotene, zygotene, pachytene, and diplotene substages) involves complex chromosome rearrangements and DNA breakage for meiotic recombination. Red checkmark represents DNA damage checkpoint activation after meiotic recombination is completed. b Model of L1 element structure. L1 encodes two proteins, ORF1p that binds RNA (RNA BP) and ORF2p that possesses the catalytic activities for retrotransposition. These are endonuclease (EN) and reverse transcriptase (RT) activities. The RT activity of ORF2p can be inhibited using the drug AZT (red). c Model of L1 reverse transcription mechanism. L1 ribonucleoprotein complexes (RNPs) contain L1 ORF1p associated with L1 RNA and L1 ORF2p in addition to other factors. L1 RNPs associate with genomic DNA where EN activity of ORF2p cuts DNA and reverse transcriptase activity of ORF2p generates L1 cDNA using the L1 RNA template. d, e Oocyte number per ovary at d E15.5 and e E18.5. f Oocyte number per ovary at P2 in Chk2+/− and Chk2−/− untreated and AZT-treated ovaries. For P2 ovaries, AZT was administered either daily from E13.5 until P2 (default), or daily from E13.5 until E18.5 (short). d–f Dots indicate independent ovary samples; data are mean + SD; n > 3 ovaries per sample from at least three different embryos and two different litters. See Supplementary Data 1a. Stats by two-tailed unpaired Student’s t-test, ns p > 0.05; *p < 0.05; **p < 0.01; ***p < 0.001. See Supplementary Data 1b. g TRA98 labeling of representative P2 Chk2+/− and Chk2−/− untreated and AZT-treated ovaries. n oocytes per ovary shown. Scale bar:100 μm. h Schematic for continuous and short AZT administration regimens. i Dynamics of FOA between E15.5 and P2 visualized as percent of maximum starting oocyte number at E15.5. Chk2+/− and Chk2−/− untreated and AZT-treated ovaries (default continuous and short AZT treatments) are shown.

