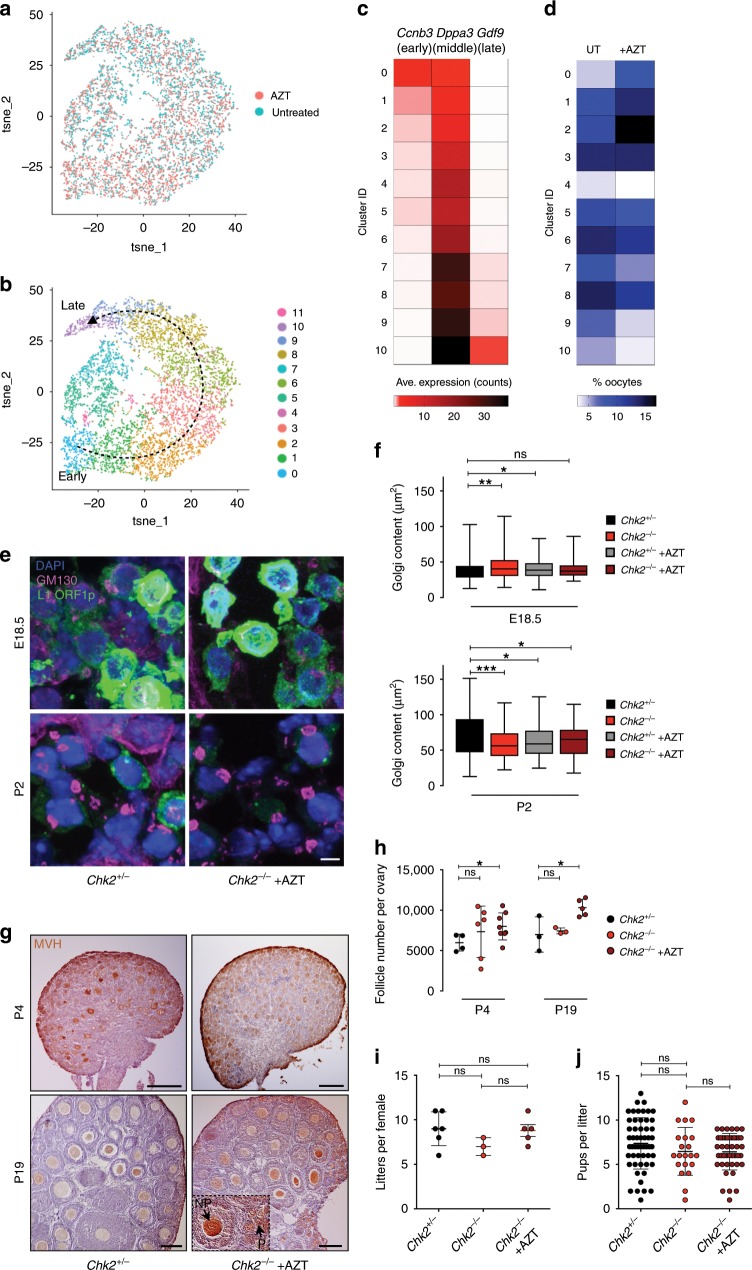
Fig. 4. Oocyte differentiation and physiology are independent of FOA.
a T-SNE plot displaying integrated E18.5 UT (blue) and AZT-treated (orange) oocytes colored by original identities. b T-SNE plot displaying cluster analysis of integrated E18.5 UT and AZT-treated oocytes. 11 clusters formed, cluster 11 removed from downstream analyses because top genes were mitochondrial, indicative of poor quality. Developmental trajectory based on known marker genes is indicated by arrows. c Heatmap of average expression of early (Ccnb3), middle (Dppa3), and late (Gdf9) marker genes within individual clusters. Clusters ordered from early to late developmental timepoints. d Percent of oocytes in untreated or AZT-treated samples belonging to each cluster, ordered from early to late developmental timepoints. Approximately 16,000 single-cells and 50,000 reads/cell collected from WT CD1 E18.5 untreated and AZT-treated ovaries from one litter of at least six pairs of ovaries each. Experiment repeated one time for both untreated and AZT-treated samples, but with ~5000 single-cells per sample and 7000–10,000 reads/cell (Supplementary Data 6c). e GM130 and L1 ORF1p expression in representative E18.5 and P2 Chk2+/− and Chk2−/− + AZT ovary sections. Scale bars: 5 μm. f Golgi area (μm2) in Chk2+/− and Chk2−/− untreated and AZT-treated E18.5 and P2 ovaries. Box plots indicate center line at median value, box limits at upper and lower quartile values, and whiskers at max and min values; n > 70 oocytes per sample. Stats by Kolmogorov–Smirnov test, ns p > 0.05; *p < 0.05; **p < 0.01; ***p < 0.001. g MVH and hematoxylin labeling of P4 and P19 Chk2+/− and Chk2−/− + AZT ovaries. Scale bars:100 μm. Inset exemplifies primordial (P) and non-primordial (NP) follicles. h Quantification of follicles in P4 and P19 ovaries. Dots indicate independent ovary samples; data are mean + s.e.m.; n > 3 ovaries per sample. i Number of litters from Chk2+/−, Chk2−/−, and Chk2−/− + AZT females crossed to Chk2+/− males. Dots indicate independent females; data are mean + SD; n > 3 females per condition. j Pups per litter from Chk2+/−, Chk2−/−, and Chk2−/− + AZT females crossed to Chk2+/− males. Dots indicate independent litters; data are mean + SD; n > 21 litters per condition. h–j Stats by two-tailed unpaired Student’s t-test, ns p > 0.05; *p < 0.01.

