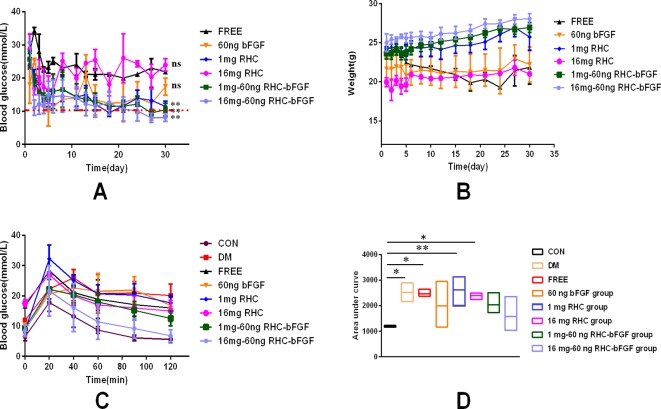
Figure 5.
Glucose regulation, body weight, and oral glucose tolerance test (OGTT) after islet transplantation. (A) No fasting blood glucose levels from day 0 (day of transplantation) to day 30 post-transplantation. (**P < 0.01, nsP > 0.05, compared to FREE.) (B) Change in body weight from day 0 (day of transplantation) to day 30 post-transplantation. (C) OGTT of all groups on day 30 post-transplantation. (D) Area under the curve (AUC) of corresponding OGTT values for all groups on day 30 post-transplantation. (**P < 0.01, *P < 0.05, compared to CON.)

