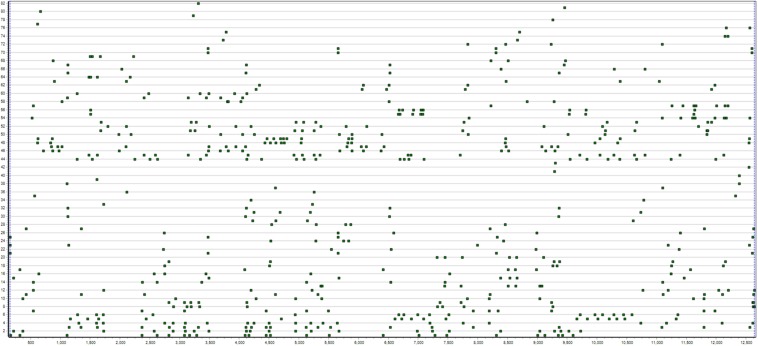
FIGURE 1.
This figure shows T-data of a 13.5 min children’s free dyadic object play interaction where two 5-year-old girls take turns watching pictures in a picture-viewer. Each line of points represents the start or stop moments for a particular behavior for one or the other. In this image, the 82 series are sorted by actor (child) and frequency.

