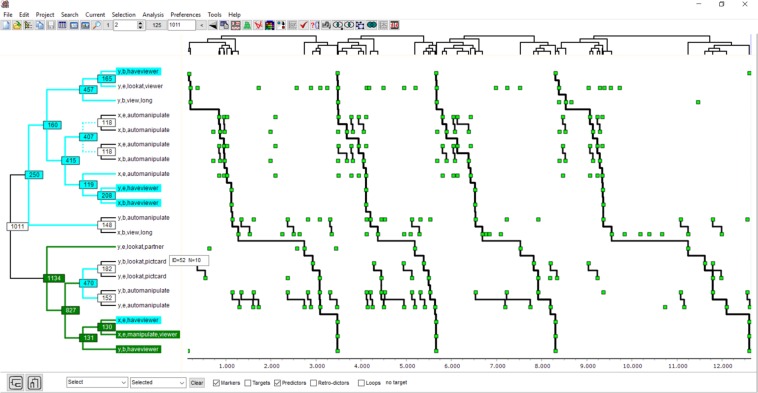
FIGURE 3.
This figure shows one T-pattern detected in the T-data shown in Figure 1. The clustering diagram on the left shows how points in the series on the right are connected level-by-level to form the four occurrences of the complete pattern. x and y in the labels represent the two girls, and b or e stand for beginnings or ends.

