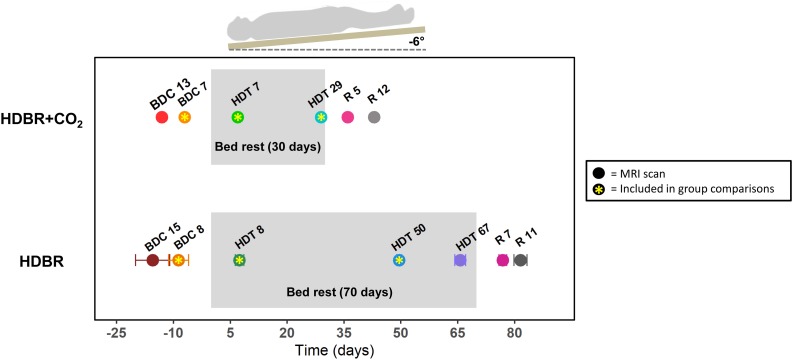
FIGURE 1.
Testing timeline. Top: testing timeline for the HDBR + CO2 group, who completed 30 days of head-down-tilt bed rest (HDBR) with 0.5% elevated atmospheric CO2. Bottom: testing timeline for the HDBR group, who completed 70 days of HDBR with normal atmospheric CO2 levels. BDC, baseline data collection; HDT, head-down-tilt bed rest; R, recovery. Circles indicate the day for each MRI scan. Circles with asterisks represent the three time points used to create intercept and slope images for between-group comparisons. All HDBR + CO2 subjects completed MRI scans on exactly the same days with respect to bed rest. There was some variability in testing days for the HDBR group; average day is plotted, with error bars indicating standard deviation. Mobility and balance data were collected at all time points for the HDBR + CO2 group, with the exception of HDT 7 and HDT 29 (i.e., participants did not complete standing tasks during bed rest). One additional mobility and balance data collection took place on R0 for the HDBR + CO2 group within ∼3 h of first standing up. Mobility and balance scores at BDC 7 and R 0 were used for brain-behavior correlations with MRI data from BDC 7 and HDT 29.

