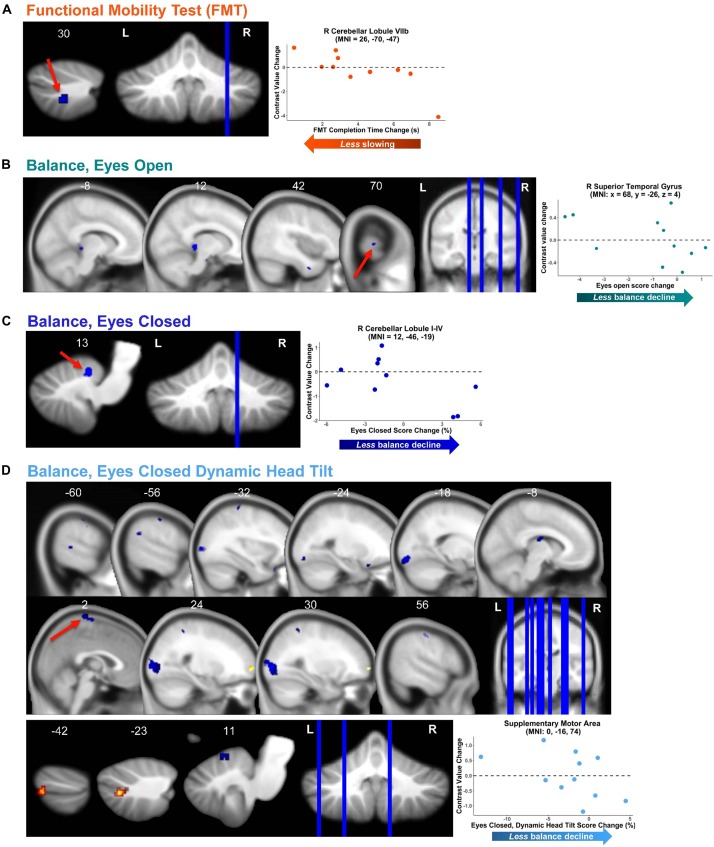
FIGURE 6.
Functional behavioral consequences. Brain—behavior correlations for functional mobility test (FMT; A) and three balance tasks (B–D). Brain change was calculated as the difference in brain activation from pre-HDBR + CO2 (time BDC 7) to the end of HDBR + CO2 (time HDT 29). Behavior change was calculated as the difference in mobility and balance performance from pre-HDBR + CO2 (time BDC 7) to post-HDBR + CO2 (time R0). Whole brain and cerebellar results are overlaid onto MNI and SUIT standard templates, respectively; non-parametric p < 0.0005, k = 10. Warm colors indicate regions of positive correlation between brain change and behavior change. Cool colors indicate regions of negative correlation between brain change and behavior change. Right side correlation plots include contrast values extracted from peak coordinate inside an example cluster (indicated with red arrows), graphed against behavior change score.

