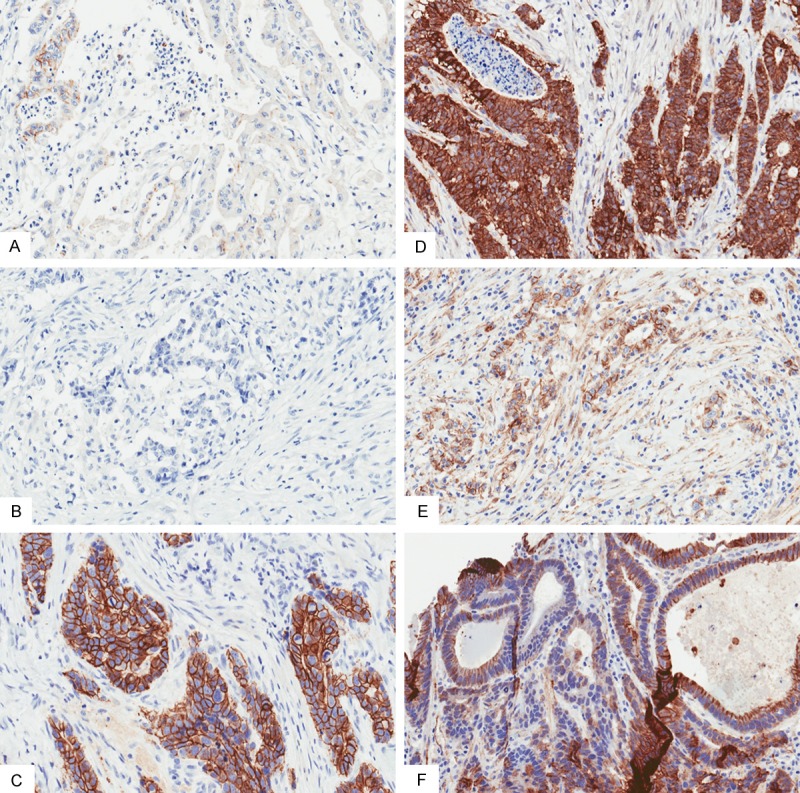
Figure 1.

E-cadherin (A-C) and beta-catenin (D-F) staining patterns in a variety of gastric cancers showing staining heterogeneity (20× magnification). (A, B) Examples of tumors with loss of membranous staining in 10% of cells and weak intensity of staining, (C, D) Examples of preserved membranous staining with normal intensity of staining, (E, F) Note the heterogeneity in the staining of some tumors with weak intensity of staining throughout but no areas with loss of staining (E), while other tumors have focal strong intensity of staining but with large areas with loss of membranous staining (F).
