
Figure 2.
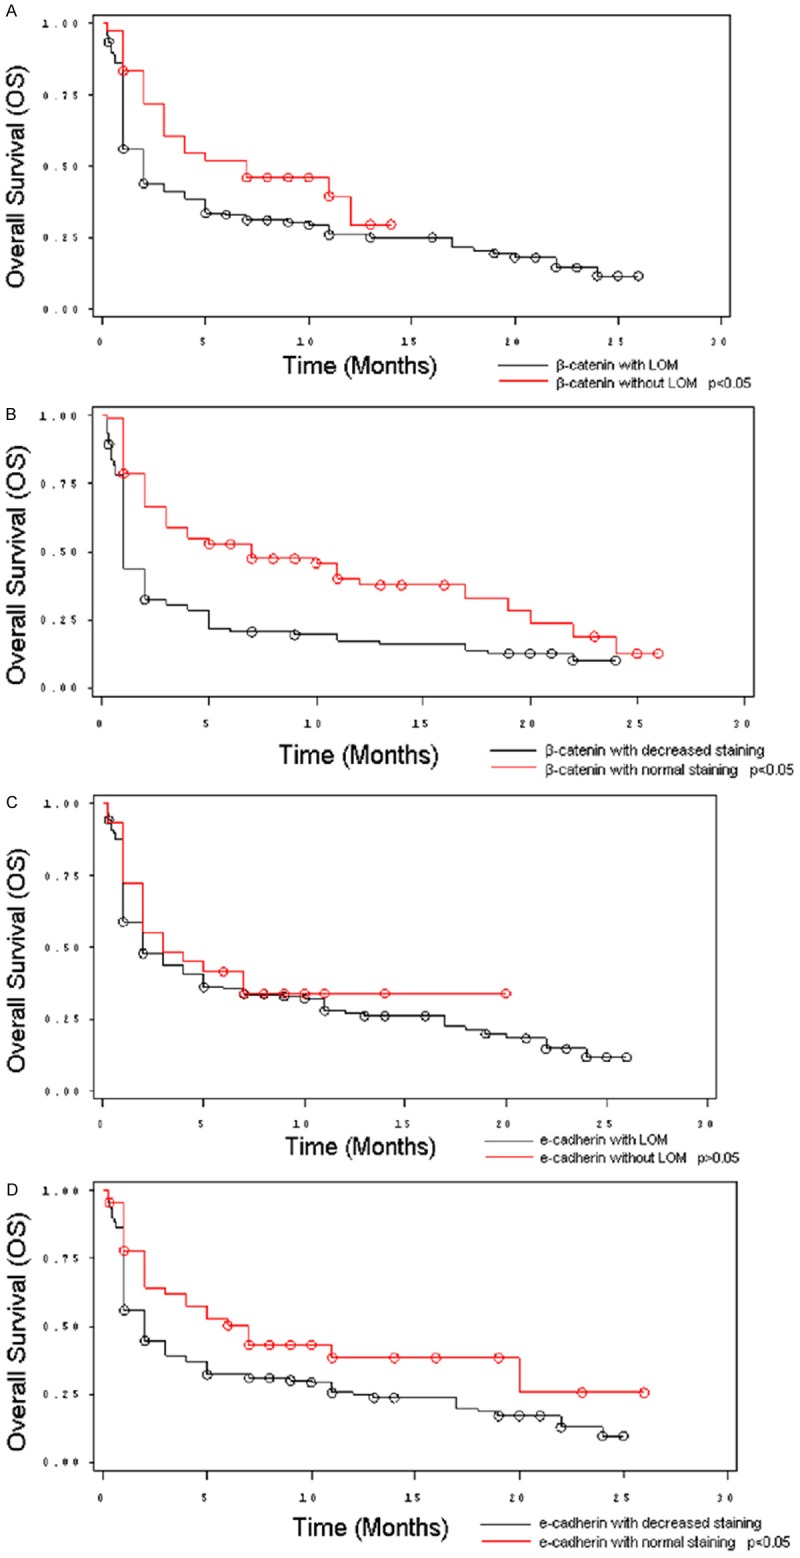
Kaplan-Meier Curves showing the overall survival of 205 gastric cancer patients based on E-cadherin and β-catenin expression patterns. A. Curve shows a significant association between loss of β-catenin staining and worse overall survival. B. Curve shows a significant association between weak β-catenin and worse overall survival. C. Curve shows a trend towards worse overall survival with loss of E-cadherin staining. D. Curve shows a significant association between weak E-cadherin staining and worse overall survival.