Figure 4.

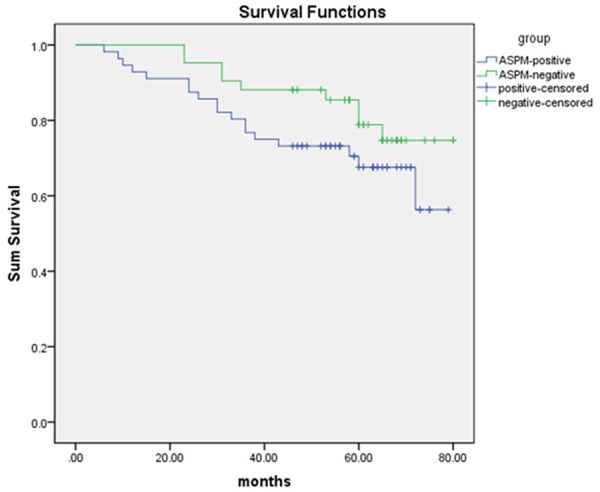
Kaplan-Meier survival analysis by ASPM status. The y-axis represents the percentage of patients; the x-axis represents their survival in months.

Kaplan-Meier survival analysis by ASPM status. The y-axis represents the percentage of patients; the x-axis represents their survival in months.