
Figure 2.
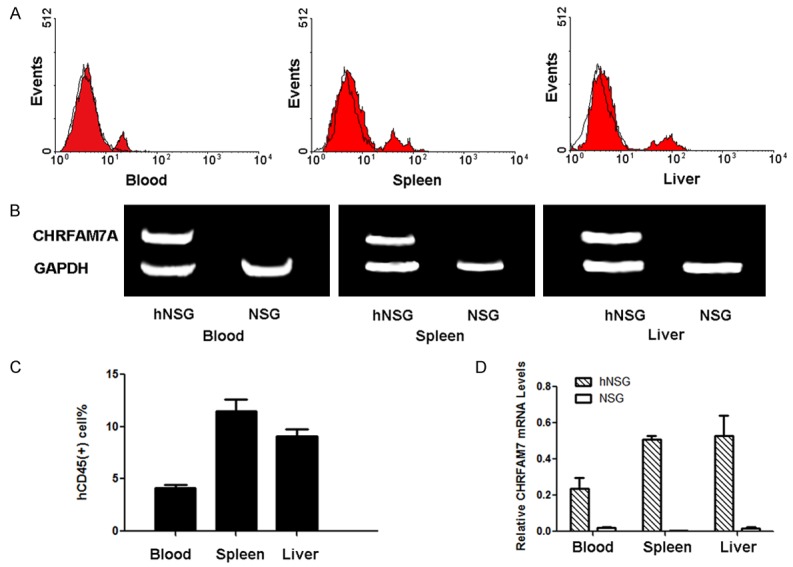
Human peripheral blood cells circulate in humanized mice. A. Histograms showing the results of flow cytometry for human CD45. B. Gel images of RT-PCR analyses of CHRFAM7A expression. C. Statistical analysis of the proportion of hCD45-positive cells in the blood, spleen and liver. D. Statistical analysis of relative mRNA levels in the blood, spleen and liver.