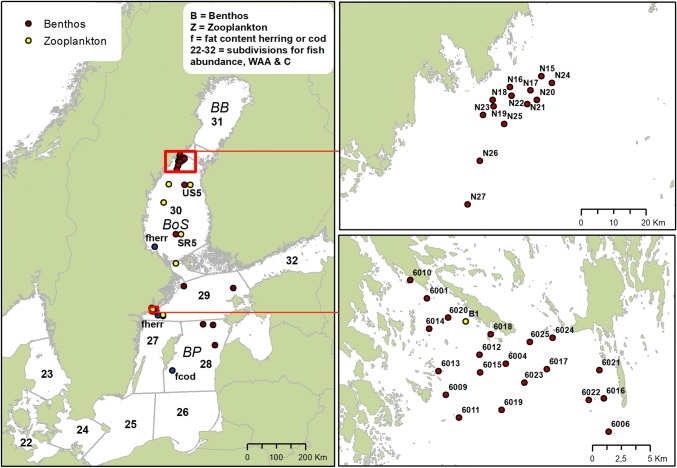
Fig. 1.
Map of the Baltic Sea with its major basins; Bothnian Bay (BB), Bothnian Sea (BoS) and the Baltic Proper (BP), showing the used sampling stations (see inserted legend). Fish data are assembled based on ICES subdivisions (SD), shown as numbers in the left panel; the cod stock is distributed over SD 25–29 (i.e. the Baltic Proper), the BP stock of herring occurs in SD 25–29 and 32, while the herring in the BoS is a separate stock (SD 30). Sprat and gray seal represent the same stock/population in all of the Baltic Sea (SD 22–32). Zoomed-in maps show zooplankton and benthos stations in the Askö area (lower right panel) and in the northern Bothnian Sea (upper right panel). Data on M. affinis embryo viability originate from stations 6004, 6019, 6020, 6022 and 6025 in BP, and from N19, N25, N26, N27 and US5 in BoS. The five benthos stations in the left panel (BP) are referred to as open sea stations. See text and Table 1 for details on monitoring programs and Table S1 for details and meta-data on sampling stations

