
Figure 5.
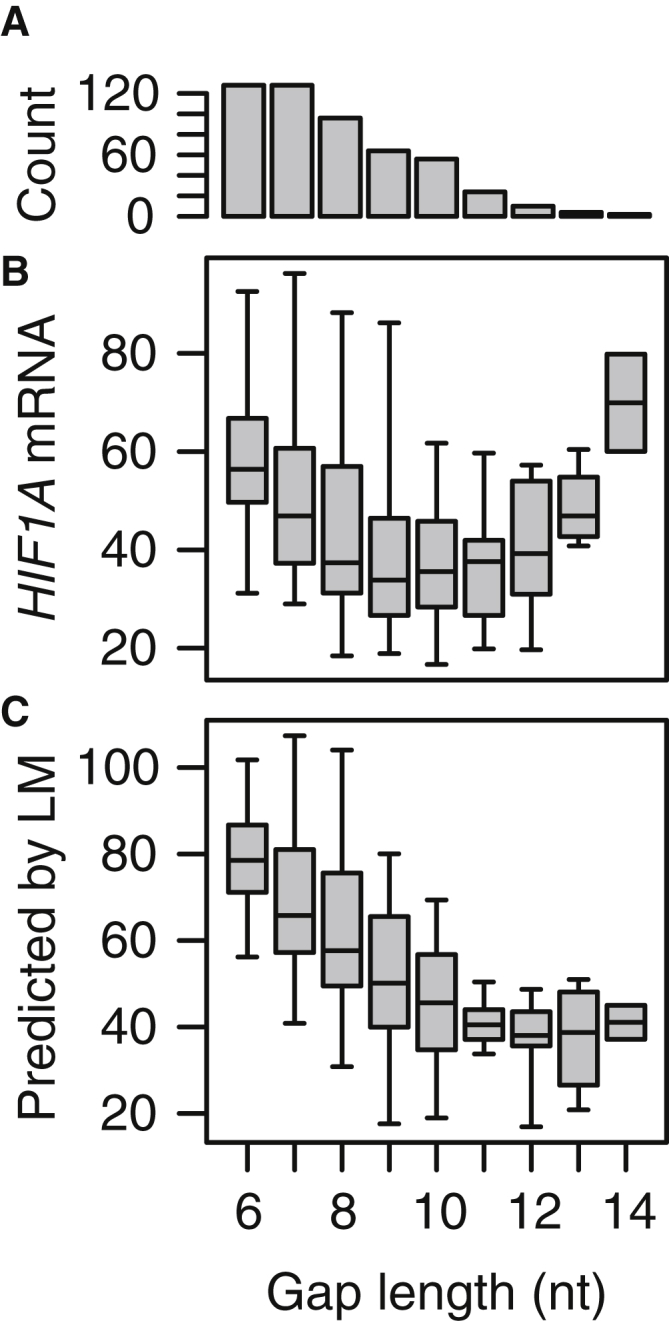
Measured and Predicted Knockdown Activities for 16-nt Gapmers Stratified by Gap Sizes
(A) Barplot showing number of 16-nt gapmers with gap sizes from 6 to 14 nt. (B) Boxplots of measured knockdown activities of HIF1A mRNA (%PBS) for 16-nt gapmers stratified by gap size. (C) Boxplots of predicted knockdown activities for 16-nt gapmers stratified by gap size.