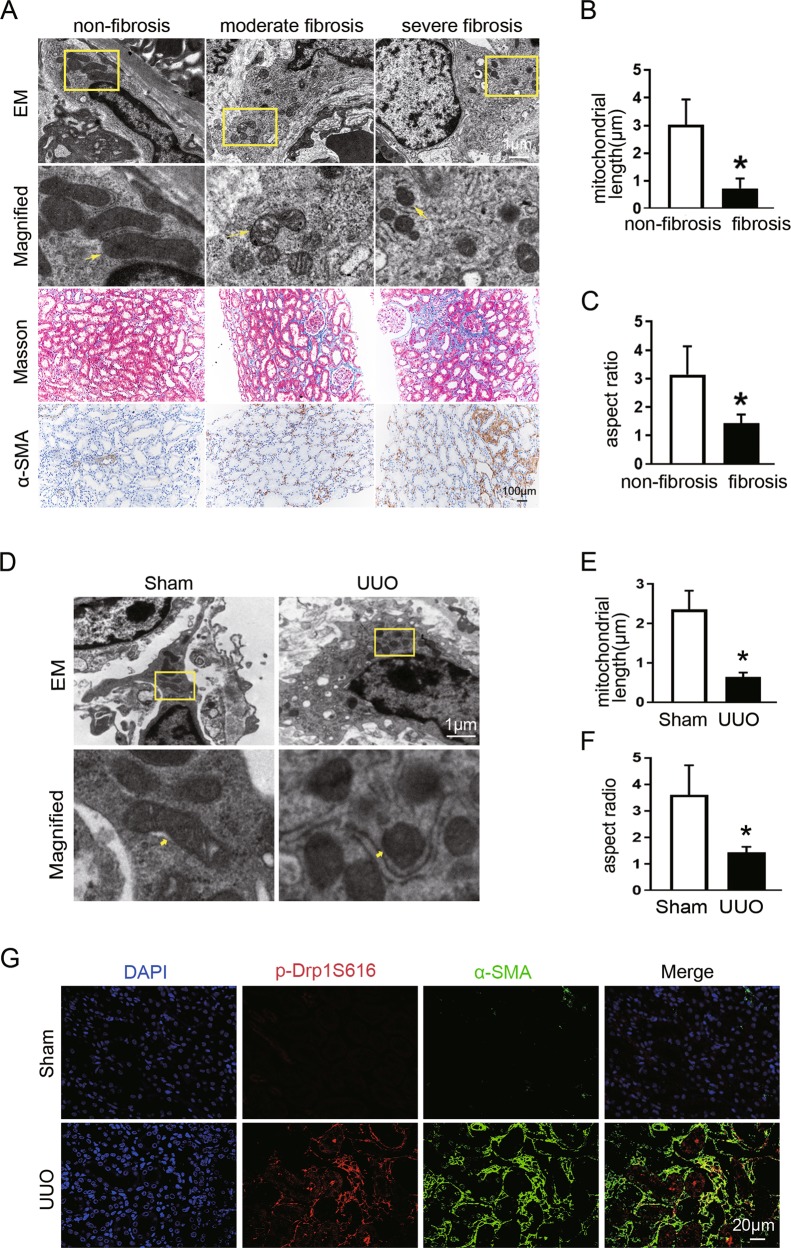
Fig. 1. Mitochondrial fission is increased in interstitial fibroblasts in fibrotic kidneys from CKD patients and UUO mice.
a Representative electron micrographs of mitochondrial morphology in fibroblasts, Masson staining, and the α-SMA immunochemical staining of renal sections from patients with different degree of renal fibrosis. Yellow arrows indicate mitochondria. b Quantitative analysis of mitochondrial length in fibroblasts among groups as indicated. c Quantification of mitochondrial aspect ratio in fibroblasts in each group. Data in b and c are means ± SEM (n = 23 in non-fibrosis group and n = 20 in fibrosis group); *p < 0.05 vs non-fibrosis. d Representative electron microscopy images of fibroblast mitochondria in sham and UUO kidneys. Yellow arrows indicate mitochondria. e Quantitative data showing mitochondrial length. f Quantitative analysis of mitochondrial aspect ratio. g Representative immunofluorescence staining of Drp1S616p (red) and α-SMA (green) in kidneys from mice subjected to sham or UUO operation. Data in e and f are means ± SEM (n = 6 per group); *p < 0.05 vs sham.

