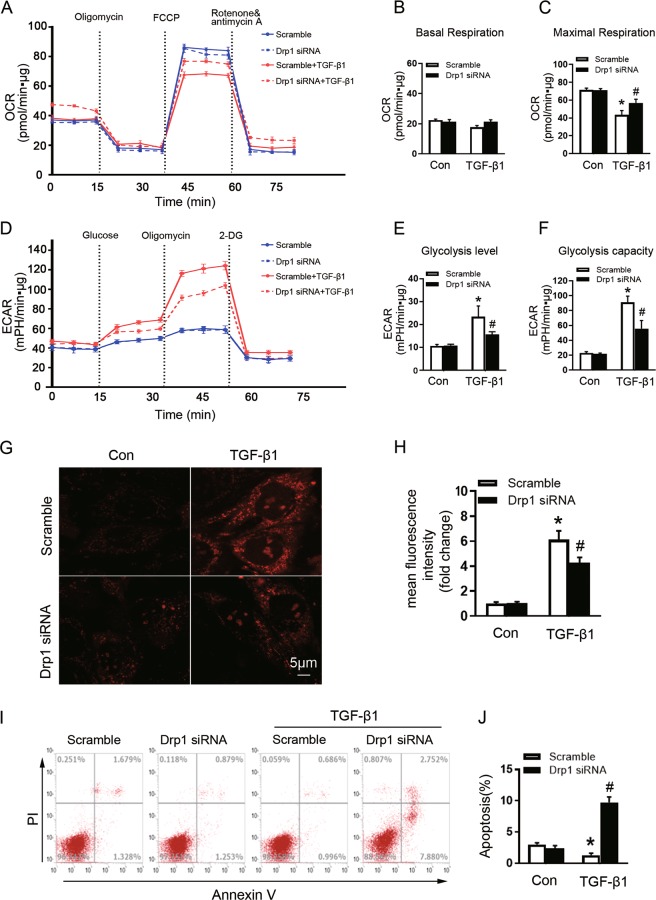
Fig. 5. Knockdown of Drp1 reverses TGF-β-induced fibroblast mitochondrial dysfunction and apoptosis resistance.
a–c Measurements of the OCR and d–f the ECAR metabolic profile in NRK-49F cells expressing either Drp1 siRNA or scramble siRNA and exposed to TGF-β1, as described in the Materials and methods section. Mitochondrial basal respiration (b), mitochondrial respiration capacity (c), glycolytic level (e), and glycolysis capacity (f) of cells among different groups as indicated. g Representative graphs of MitoSOX red stained in cells among different groups as indicated. h Analysis of MitoSOX Red fluorescence intensity among different groups as indicated. i The apoptosis was examined by flow cytometry analysis among groups as indicated. j The quantification analysis of the percentage of apoptotic cells. Data in b, c, e, f, h, and j are means ± SEM (n = 3); *p < 0.05 vs control cells; #p < 0.05 vs TGF-β1-treated cells with scramble siRNA.

