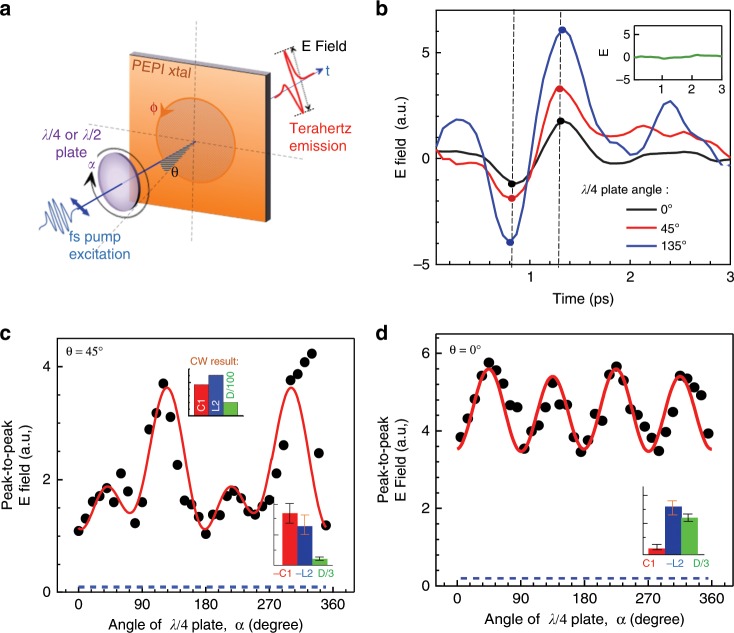
Fig. 3. Terahertz (THz) emission due to ultrafast photogalvanic (PGE) currents in 2D-PEPI crystal.
a schematic illustration of the experimental setup for the THz emission measurements. The angles α, θ, and φ are denoted. b THz time-domain emission waveforms measured at λ/4 waveplate angle, α of 0°, 45° and 135˚ as denoted, that correspond to linear polarized (LP), right circularly polarized (RCP) and left circularly polarized (LCP) light. The two dashed black lines mark the times where positive and negative peaks of the terahertz emission were determined. The peak-to-peak values are determined from the addition of the absolute positive and negative values as marked by the dots. The inset shows a null signal obtained when resonantly excited at the exciton band (2.34 eV). c Terahertz field emission vs. the rotation angle, α, photogenerated using 3.06 eV pulsed excitation at θ = 45°. The red line through the black data points is a fit using Eq. (1). The inset shows the obtained relative values of the coefficients C1, L2, and D; d Similar measurements as in panel c, for incident angle, θ = 0˚. The fit using Eq. (1) shows majority contribution from L2. The blue dashed line marks the noise level corresponding to zero emission field.

