Figure 2.

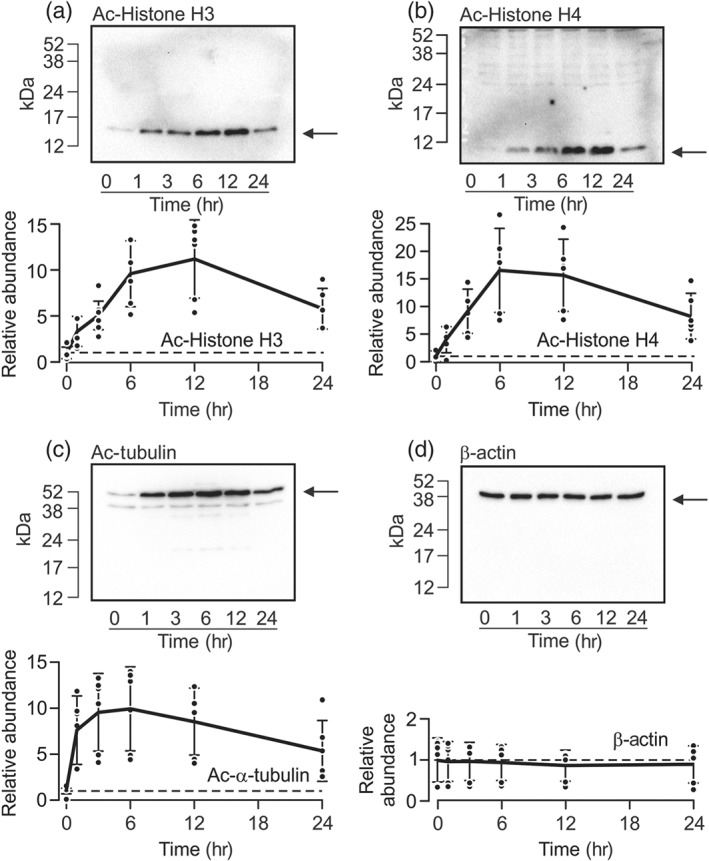
Time course of TSA‐induced acetylation. Protein extracted from cells exposed to 1‐μM TSA for 0–24 hr was subject to western analysis using antibodies against the acetylated forms of histone H3 (a, Ac‐Histone H3, n = 6), histone H4 (b, Ac‐Histone H4, n = 6), and α‐tubulin (c, Ac‐α‐tubulin, n = 6). All blots were then re‐probed using the antibody against β‐actin (d). In each figure, the upper panel shows the results of a representative experiment, whilst the densitometric analyses presented below show the changes to the abundance of each protein plotted against time. Data are mean ± 95% CI
