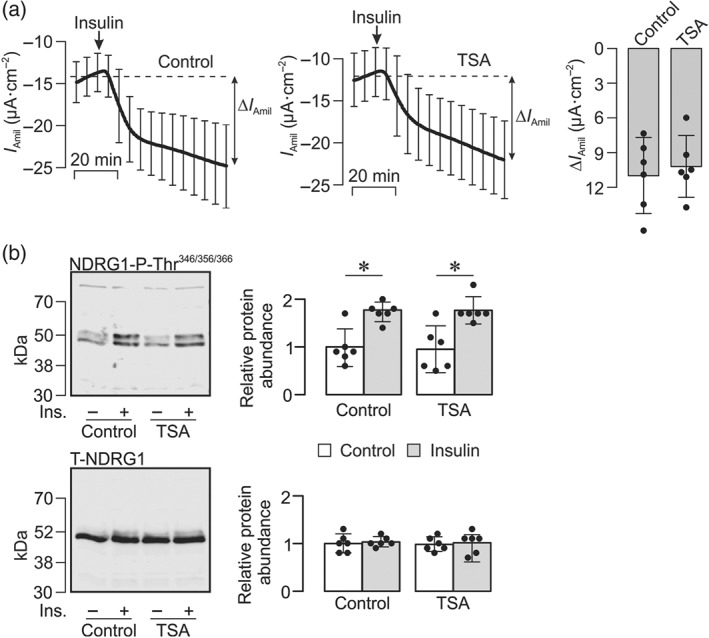
Figure 5.

Insulin‐induced Na+ transport and SGK1 activity. (a) Confluent cells on Costar Snapwell membranes were mounted in Ussing chambers so that the effects of insulin (20 nM) upon I Amil could be continuously recorded (mean ± 95% CI, n = 6) under control conditions (left panel) and in cells that had been pretreated (2 hr) with 1‐μM TSA (middle panel). The amiloride‐sensitive responses to insulin (ΔI Amil) were quantified and presented as mean ± 95% CI (right panel). (b) Typical blots obtained using antibodies against the Thr346/356/366‐phosphorylated form of the protein encoded by N‐myc downstream regulated gene 1 (upper panel, NDRG1‐P‐Thr346/356/366) and the equivalent full length protein (lower panel, T‐NDRG1). Pooled data (right‐hand panels) from the entire series of experiments showing (mean ± 95% CI, n = 6) the effects of insulin (20 nM, 1 hr) upon the abundance of NDRG1‐P‐Thr346/356/366 (upper) and total NDRG1 (lower) in control and TSA‐treated (1 μM, 2 hr) cells. *P<0.05, significantly different as indicated; two‐way ANOVA and Tukey's post hoc test
