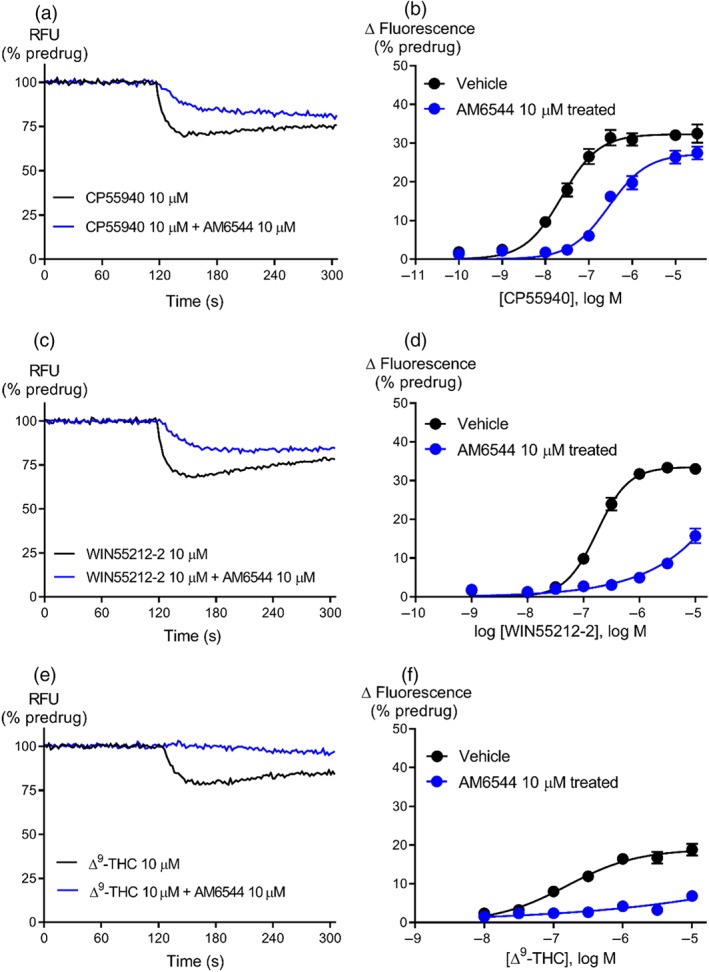
Figure 2.

Representative traces for research cannabinoids CP55940 (a), WIN55212‐2 (c), and ∆9‐THC (e) following pretreatment with vehicle or AM6544 (10 μM) on AtT‐20‐CB1 cells. Raw trace showing reduction in hyperpolarisation induced by maximally effective concentration (10 μM) of CP55940, WIN55212‐2, and ∆9‐THC after AM6544 pretreatment compared to vehicle. Concentration–response curves for (b) CP55940 (n = 20), (d) WIN55212‐2 (n = 7), and (f) ∆9‐THC (n = 6) were plotted using five‐parameter non‐linear regression to fit the operational model‐receptor depletion equation with basal constrained to 0. Data represent the mean ± SEM of technical replicates. For some points, the error bars are smaller than the height of the symbol.
