
Figure 4.
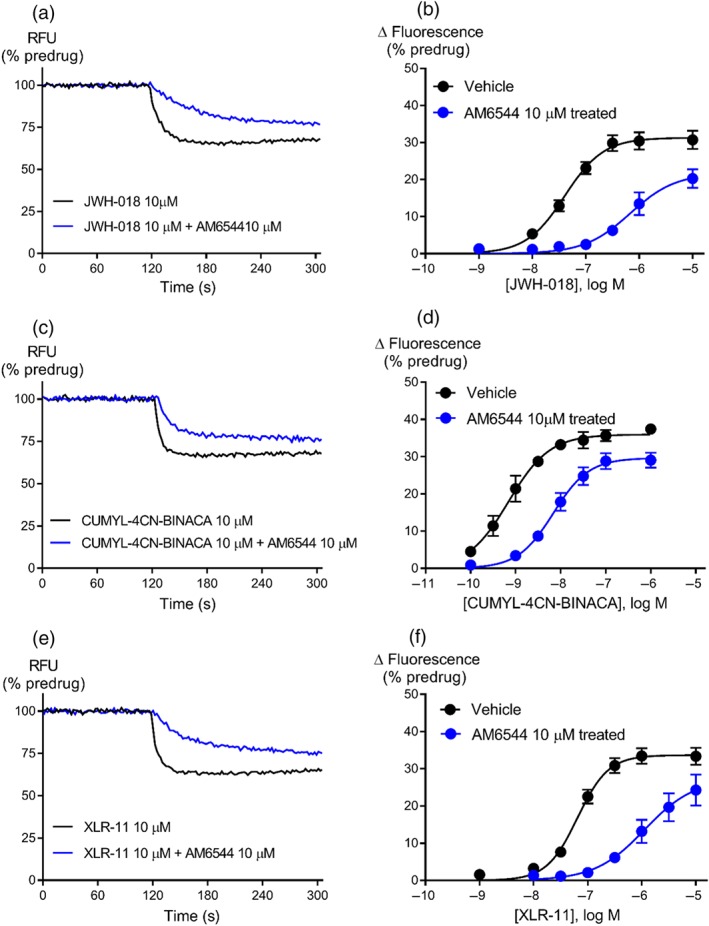
Representative traces for JWH‐018 (a), CUMYL‐4CN‐BINACA (c), and XLR‐11 (e) following pretreatment with vehicle or AM6544 (10 μM) on AtT‐20‐CB1 cells. Raw trace showing reduction in hyperpolarisation induced by maximally effective concentration of JWH‐018 (10 μM), CUMYL‐4CN‐BINACA (10 μM), and XLR‐11 (10 μM) after AM6544 pretreatment compared to vehicle. Concentration–response curves for (b) JWH‐018 (n = 8), (d) CUMYL‐4CN‐BINACA (n = 7), and (f) XLR‐11 (n = 7) were plotted using four parameter non‐linear regression to fit the operational model‐receptor depletion equation with basal constrained to 0. Data represent the mean ± SEM of technical replicates. For some points, the error bars are smaller than the height of the symbol.