
Figure 2.
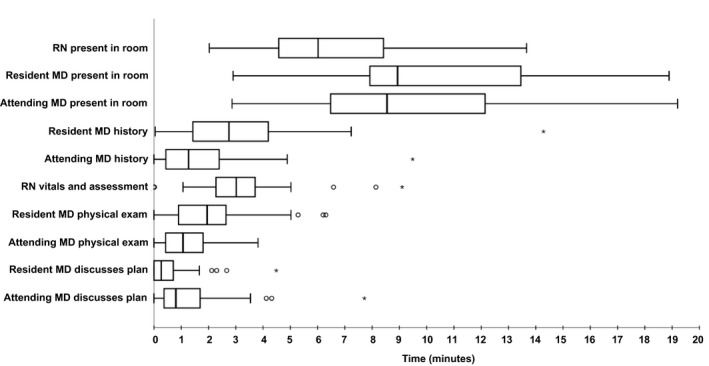
Median time duration for key aspects of the swarming encounter with interquartile range (IQR). Across the boxplots, circles are outliers (values greater than [IQR × 1.5] + 75th percentile, or less than [IQR × 1.5] − 25th percentile), and asterisks are extreme outliers (values greater than [IQR × 3] + 75th percentile). “Attending MD” in this setting refers to either the attending or fellow physician who was functioning in a supervisory role during the swarming encounter.