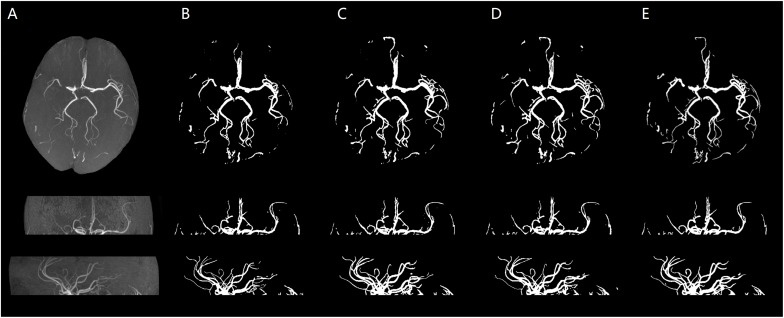
FIGURE 7.
Stroke patient. An illustration of axial MIP images of cerebrovascular segmentation results through HMRF, HMRF + SegNet2D, HMRF + U-Net3D and manual annotations. (A) TOF-MRA MIP images in axial, coronal, and sagittal three axes. (B) MIP images of HMRF result in three axes. (C) MIP images of HMRF + SegNet2D result in three axes. (D) MIP images of HMRF + U-Net3D result in three axes. (E) Manual annotations in three axes.

