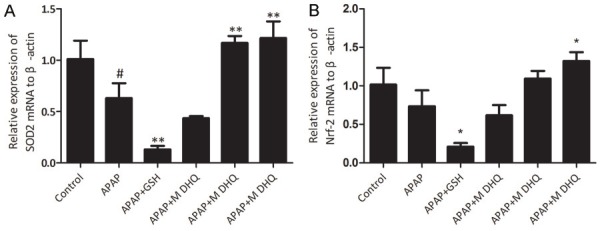
Figure 4.

Effects of DHQ on antioxidant capacity. The determination of mRNA expression of SOD2 (A) and Nrf2 (B) by RT-PCR. All data are expressed as the Mean ± SD (n=6) from three independent experiments. #P < 0.05 compared with the control group, *P < 0.05 and **P < 0.01 compared with the APAP-induced acute liver injury model group.
