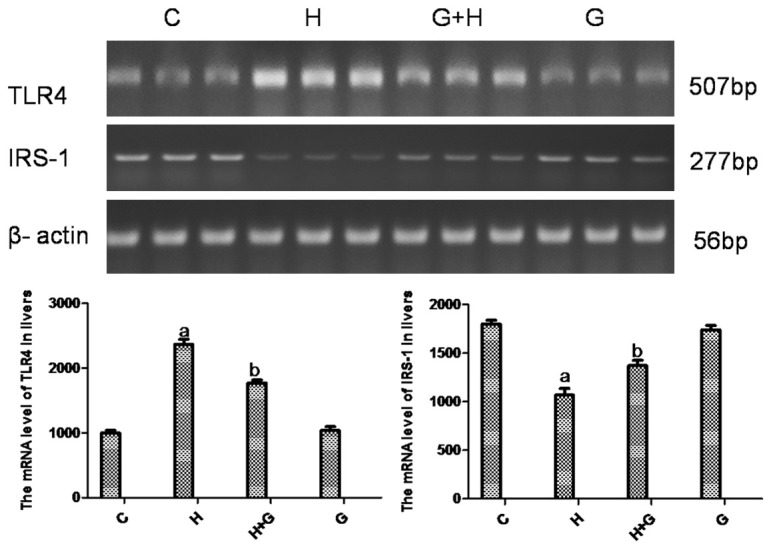
Figure 4.

Effect of glycine treatment on the mRNA expression of TLR4 and IRS-1 by PCR. Control group (C), high-fat/high-sugar group (H), high-fat/high-sugar + glycine group (H+G), glycine group (G). Data represented as mean ± standard error (n=8). aP < 0.05 vs control group; bP < 0.05 vs HSHF group.
