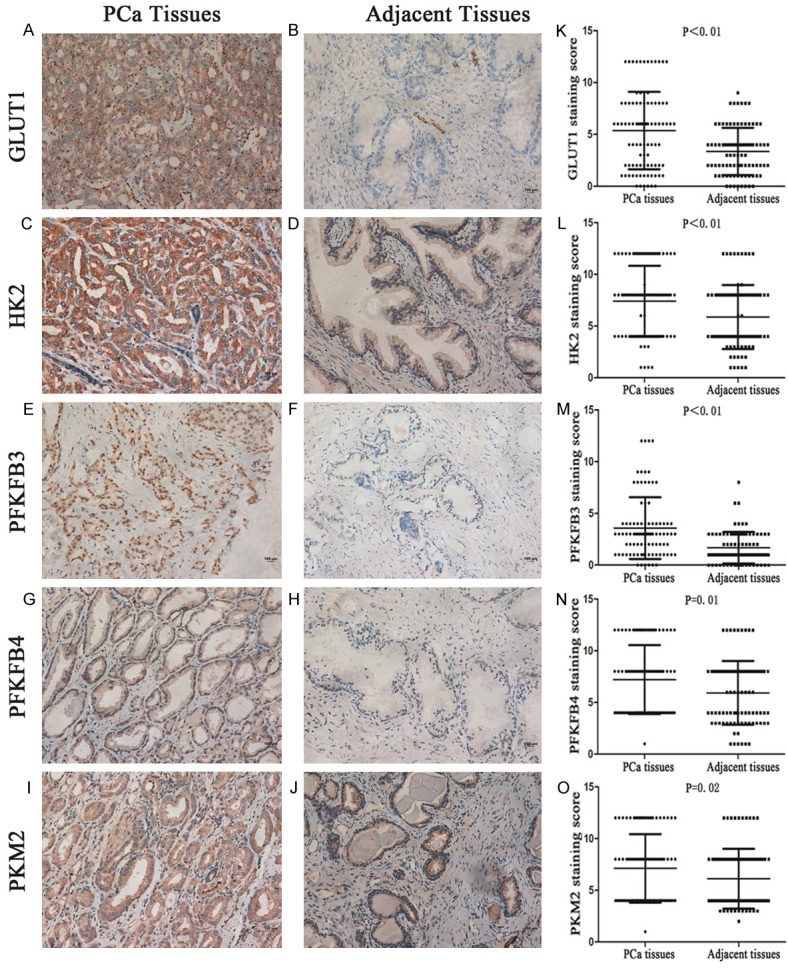
Figure 1.

Representative immunohistochemistry demonstrates that all key glycolytic enzymes, GLUT1 (A), HK2 (C), PFKFB3 (E), PFKFB4 (G), and PKM2 (I), are more highly expressed in PCa tissues than in adjacent tissues (B, D, F, H and J). The histograms (K-O) represent the IHC score of glycolytic key enzymes, and the results show that the expression levels of all enzymes were significantly elevated in PCa tissues compared with the adjacent normal tissues, as assessed by the Mann-Whitney U test.
