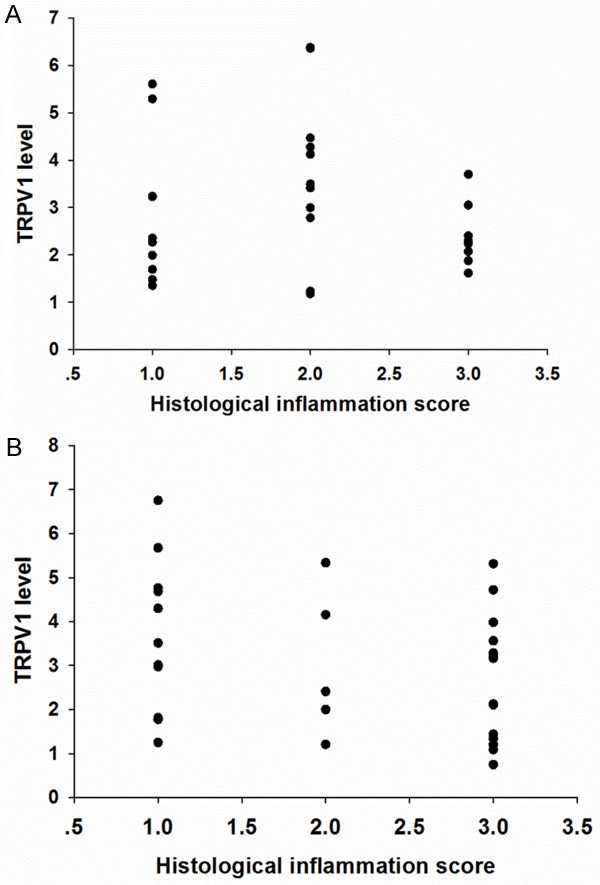
Figure 4.

A. Scatter plot showed no significant correlation between TRPV1 expression and histological inflammation score in UC group (P>0.5). B. Scatter plot showed no significant correlation between TRPV1 expression and histological inflammation score in CD group (P>0.05).
