
Figure 3.
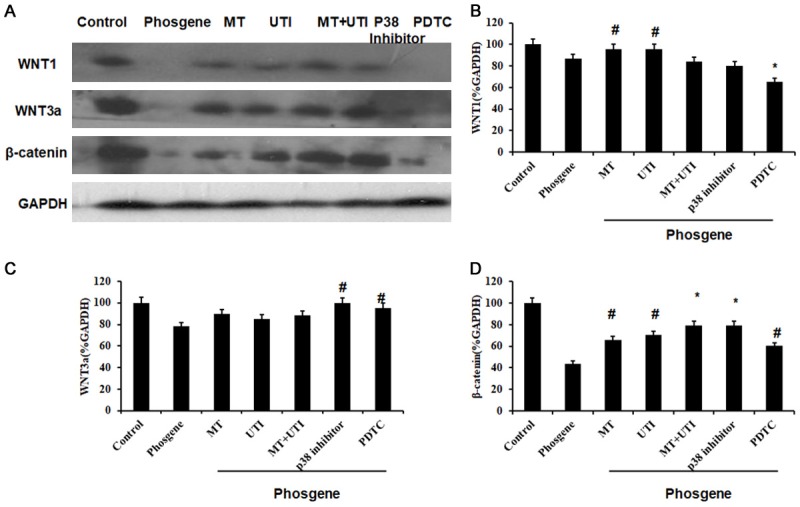
The expression of proteins in Wnt/β-catenin pathway after different treatments. (A) Western blot analysis of WNT1, WNT3a and β-catenin. Relative expression quantification of WNT1 (B), WNT3a (C) and β-catenin (D). GAPDH was loading control. Data were presented as mean ± SD (n=3). #P<0.05 vs. Phosgene group. *P<0.01 vs. Phosgene group.