
Figure 4.
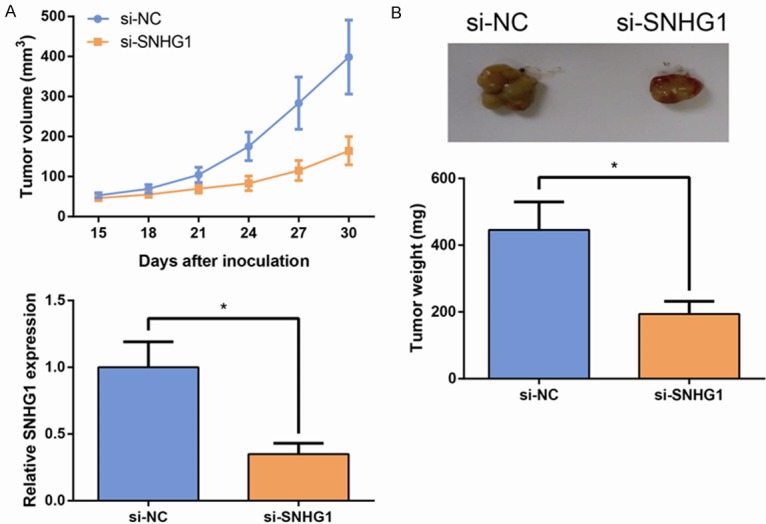
SNHG1 promotes tumorigenesis of EOC cells in vivo. A. Growth curves of tumor volumes in different groups of nude mice. B. Quantitative determination of the weight of the excised tumors. C. qRT-PCR analysis of SNHG1 expression levels in the excised tumor tissues. Data are presented as mean ± SD. The experiments were all repeated at least three times. P value was assessed by Student’s t-test. *P<0.05.