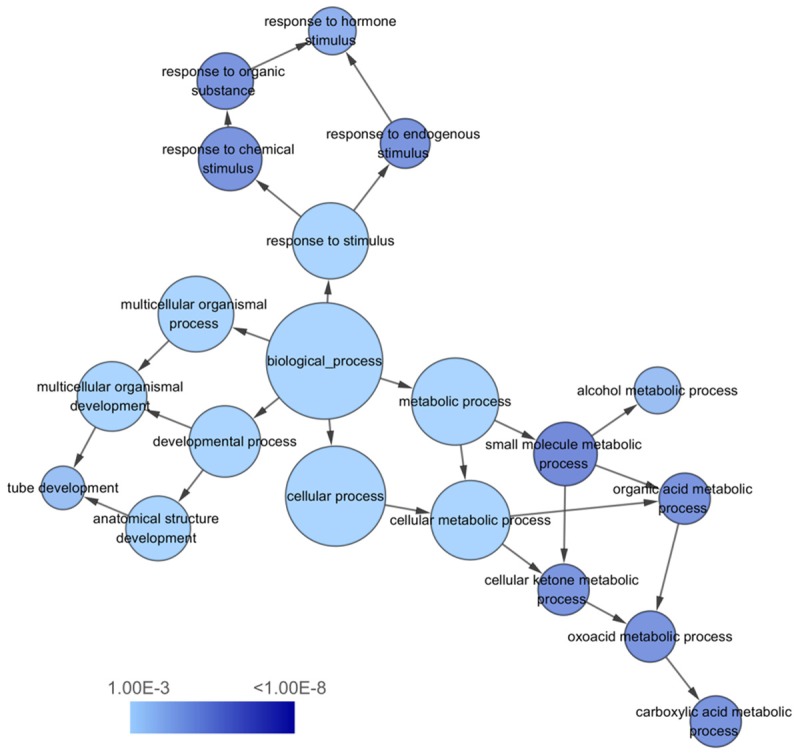
Figure 9.

The biological process (BP) network of miR-224-5p overlapping targeted genes. The circles represented different terms of biological processes and the arrows represented relationships among terms. The color of nodes indicated the significance of the corresponding term.
