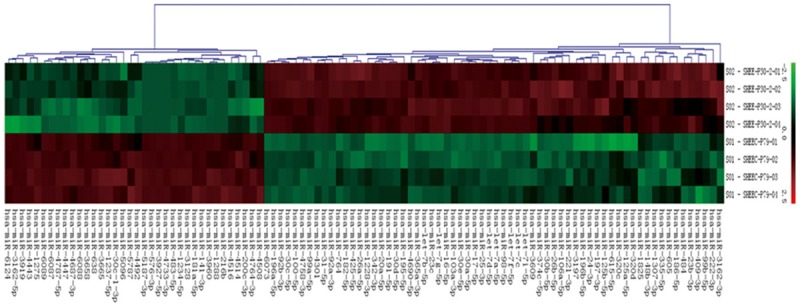
Figure 1.

Hierarchical cluster analysis of miRs expression. The heat map diagram shows the result of the two-way hierarchical clustering of genes and samples. Each column represents a miRs and each row represents a sample. The miRs clustering tree is shown on the bottom, and the sample clustering tree is shown at the right. The color scale at the top illustrates the relative expression level of a miRs.
