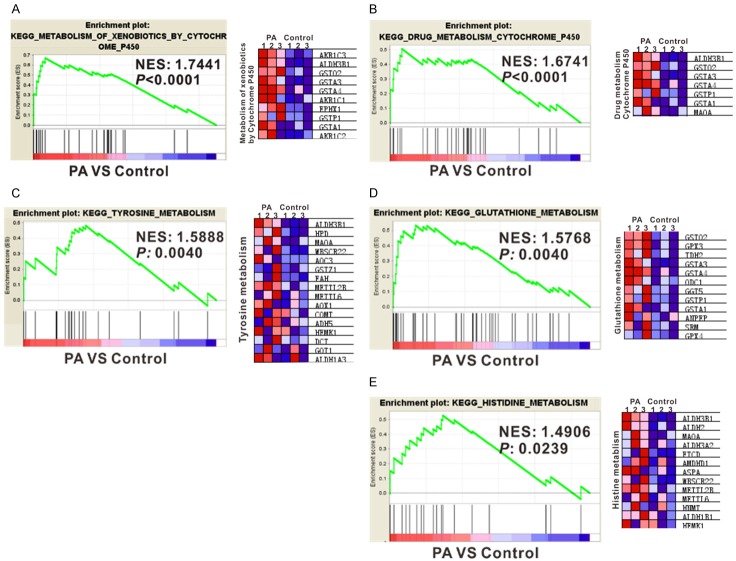
Figure 2.
Gene set enrichment analysis (GSEA) of signaling pathways strongly associated with PA (A-E). Normalized Enrichment score (NES) and P value are shown as indicated (left panels). The heatmaps of gene expression in KEGG signaling pathways were shown in the right panels. Gene expression was normalized for each row. Higher expression was represented in red and lower expression in blue.

