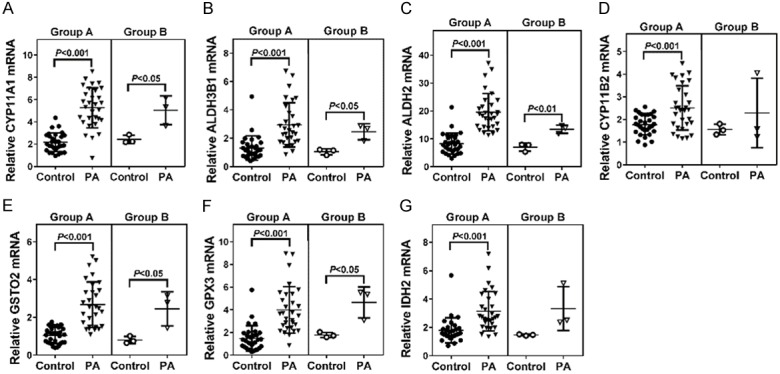
Figure 3.

The mRNA levels of CYP11A1 (A), ALDH3B1 (B), ALDH2 (C), CYP11B2 (D), GSTO2 (E), GPX3 (F) and IDH2 (G) were detected by real-time PCR. GAPDH was served as an internal control. Statistical significance was evaluated using the Student’s t-test. Group A: 30 pairs of Adrenal tumor tissue and adjacent normal adrenal samples. Group B: 3 pairs of Adrenal tumor tissue and adjacent normal adrenal samples which were also used for RNA-seq.
