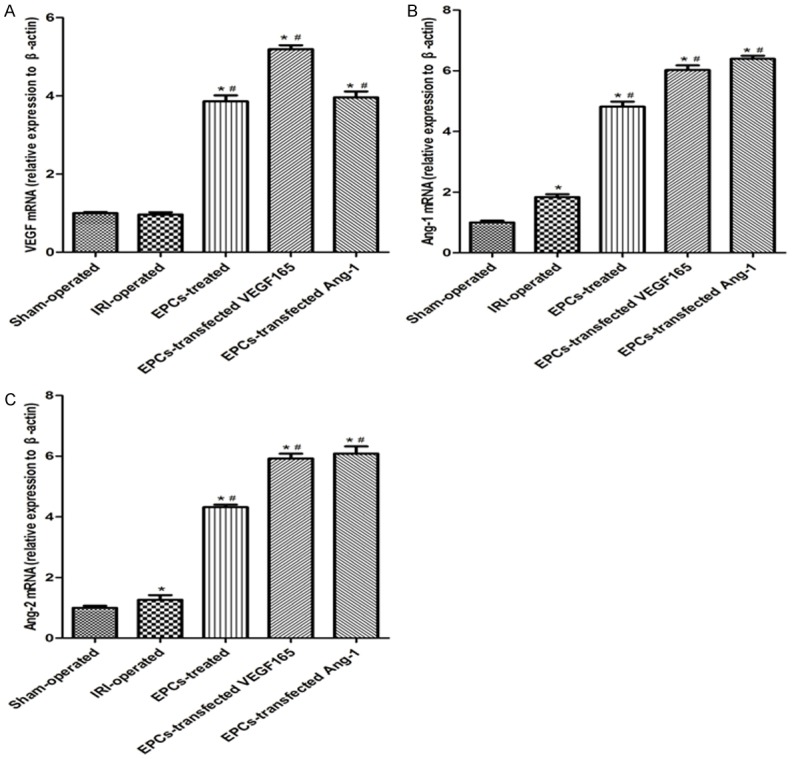
Figure 5.

Effect of EPCs transplantation on expression of mRNA levels in different groups. A-C: mRNA expression levels of VEGF, Ang-1 and Ang-2 in different groups. Data are expressed as mean ± SD. *significant difference vs. Sham group (P<0.05); #significant difference vs. IRI group (P<0.05).
