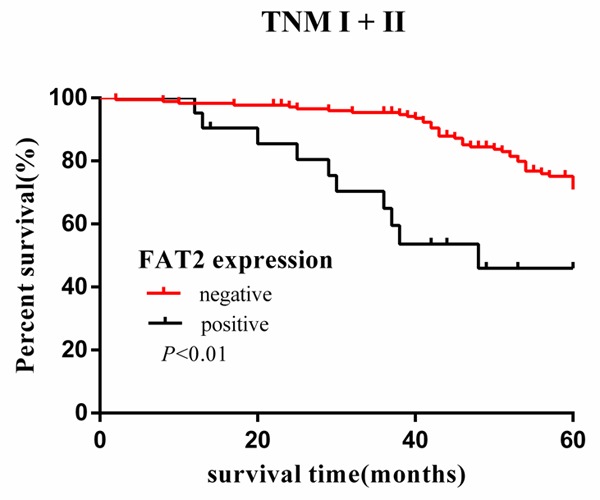
Figure 3.

Kaplan-Meier curves with univariate analyses (log-rank) for patients with low FAT2 expression versus high FAT2 expression tumors in stage I and stage II. The cumulative 5-y survival rate was 75.7% in the low FAT2 protein expression group but was only 52.4% in the high expression group (P < 0.01).
